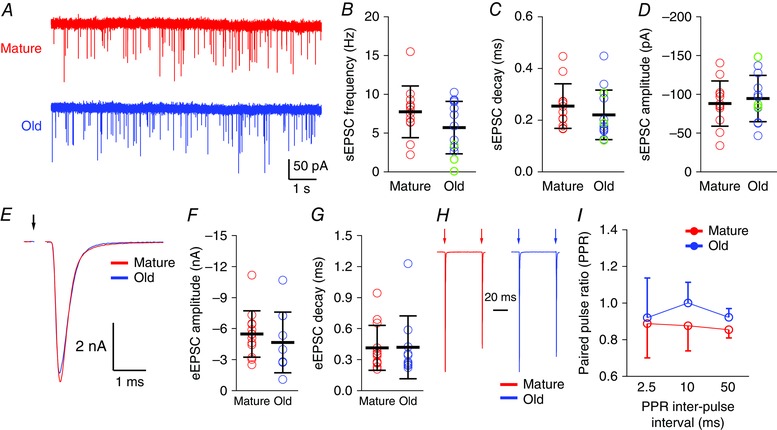
Figure 2. Synaptic transmission at the endbulb of Held in mature and old mice.

A, spontaneous EPSCs in bushy neurons in mature and old mice. B–D, summary for all bushy neurons in mature and old mice. B, sEPSC frequency; C, sEPSC decay time constant; D, average sEPSC amplitude. Circles: individual cells; red: cells from mature mice; blue: cells from old mice with evoked EPSCs; green: cells (n = 3) from old mice where stimulation failed to evoke eEPSCs. E, eEPSCs from mature and old mice. Arrow: stimulus onset. F and G, summary data for eEPSC amplitude (F) and decay time constant (G). H, example normalized paired‐pulse eEPSCs with 50 ms interval from mature and old mice. I, summary of PPR. Data are presented as mean ± SD.
