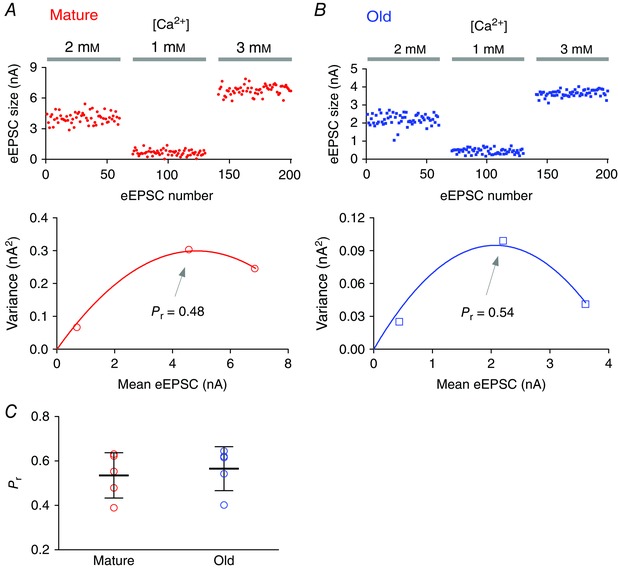
Figure 3. Initial release probability at the endbulb of Held synapses in mature and old mice assessed by variance‐mean analysis.

A, top: eEPSCs recorded from a bushy neuron of a mature mouse in response to auditory nerve stimulation under different extracellular calcium concentrations. Bottom: variance‐mean plot of eEPSCs for the three calcium concentrations. The initial release probability (P r) at 2 mm [Ca2+] was estimated by fitting the data to a parabola (see Methods). B, top: eEPSCs recorded from a bushy neuron from an old mouse. Bottom: variance‐mean plot for data in top panel. C, summary of release probabilities at 2 mm [Ca2+] in mature and old mice.
