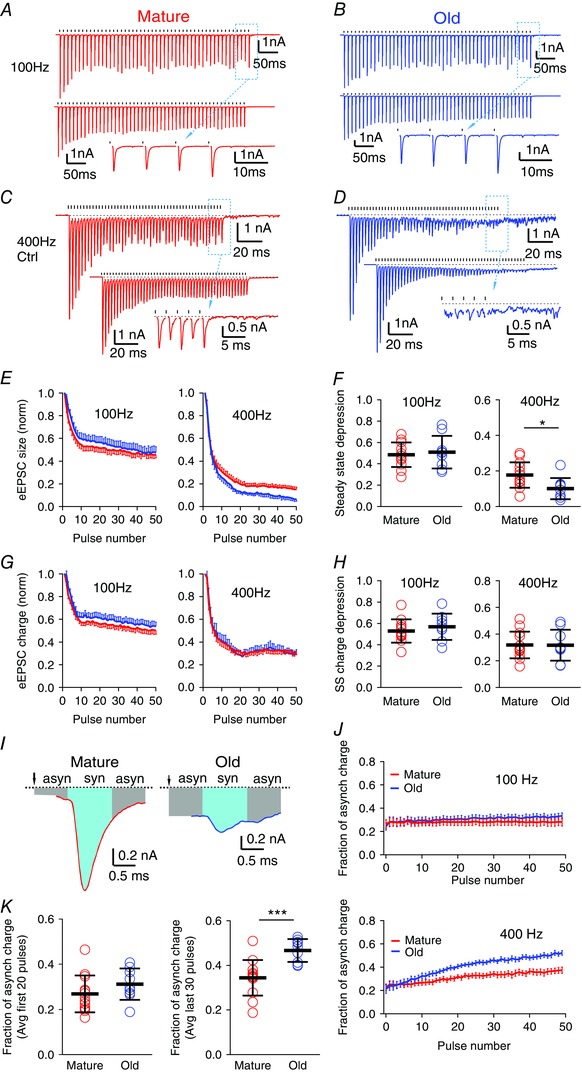
Figure 4. Asynchronous release is increased during high frequency stimulation in old mice.

A, eEPSCs of a bushy neuron from a mature mouse in response to a 50‐pulse stimulus train at 100 Hz. Top: single trial; bottom: average trace of 10 trials; inset: expanded view of the last eEPSCs from the dashed box in the top trace. Ticks above the traces mark stimulation times; dashed lines indicate the resting current. Plots in B–D are arranged the same way as in A. B, eEPSCs of a bushy neuron from an old mouse in response to a 50‐pulse stimulus train at 100 Hz. C and D, eEPSCs of bushy neurons from mature (C) and old (D) mice in response to 50 pulse‐trains at 400 Hz. Notice in D that eEPSCs show reduced peak amplitude and increased asynchronous release during the late part of the train. E, eEPSC peak amplitude throughout the stimulus train, normalized to the amplitude of the first eEPSC, at 100 and 400 Hz. F, summary of the steady state depression (average peak amplitude of the last 30 eEPSCs of the train normalized to the first eEPSC) at 100 and 400 Hz. Each symbol represents an individual neuron. G, eEPSC charge (integrated area under each eEPSC) throughout the stimulus train normalized to the charge of the first eEPSC, at 100 and 400 Hz. H, summary of the steady state (SS) charge depression (average charge of the last 30 eEPSCs of the train normalized to the first eEPSC) at 100 and 400 Hz. I, the last eEPSCs from the 400 Hz train in C (mature) and D (old). Syn: synchronous eEPSC response (cyan area); asyn: asynchronous eEPSC response (grey area). J, fraction of asynchronous release charge for each stimulus throughout the 50‐pulse train at 100 Hz (top) and 400 Hz (bottom). K, average fraction of asynchronous charge of the first 20 stimuli (left) and the last 30 stimuli (right) of the 400 Hz trains in all bushy neurons. Data in E, G and J are presented as mean ± SEM; data in F, H and K are presented as mean ± SD . * P < 0.05, *** P < 0.001.
