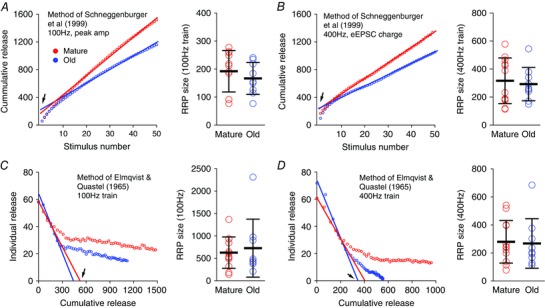
Figure 5. Estimates of RRP size in mature and old mice.

A, RRP sizes calculated in two example endbulb synapses based on the cumulative plot of eEPSC peak amplitude using 100 Hz stimulus trains using the method of Schneggenburger et al. (1999). Circles: cumulative release in vesicle numbers against stimulus number; lines: line fit to the later points of the cumulative trace (stimulus number 11–50). The y‐axis intercept (arrow) of the lines provides an estimate of the RRP size. Right panel: summary of RRP sizes in mature and old mice based on 100 Hz trains. B, RRP sizes calculated in two example endbulb synapses based on the cumulative plot of eEPSC charge using 400 Hz stimulus trains. Right panel: summary RRP sizes in mature and old mice based on 400 Hz trains. C, plots of the individual stimulus‐evoked release against corresponding cumulative release that occurred prior to the given stimulus. RRP size is estimated from the x‐axis intercept (arrow) of the fitted line to the early part of the stimulus train (method of Elmqvist & Quastel, 1965). Right panel: summary of the RRP size estimates from 100 Hz trains. D, as in C except using 400 Hz trains.
