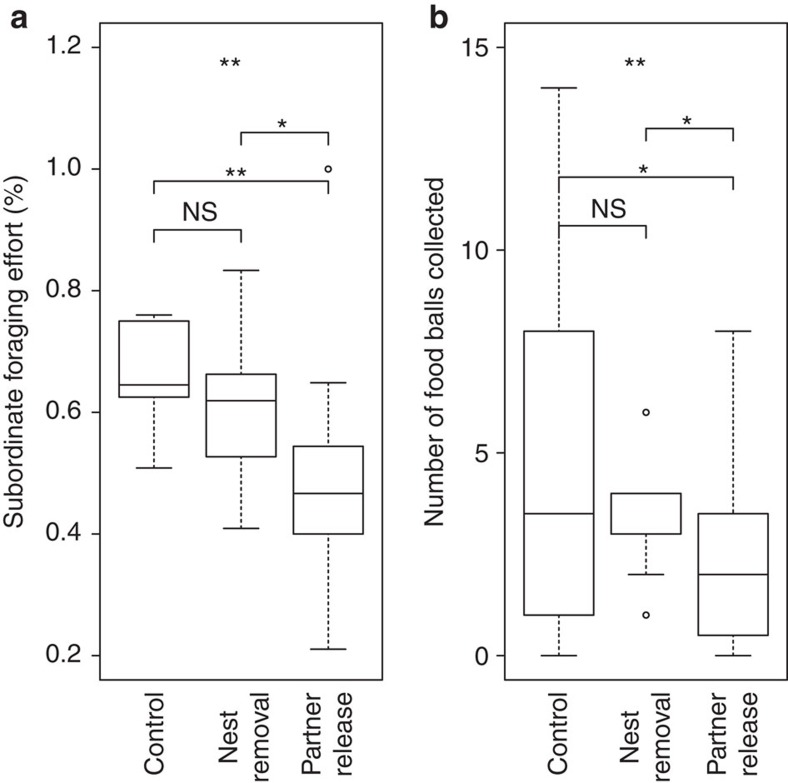
Figure 2. Subordinate foraging after the Market Manipulation treatments.
The effect of treatment on (a) collective subordinate foraging effort per nest, measured as proportion of observations where individuals were absent from the nest in daytime censuses post-treatment (GLMM: overall effect of treatment: P=0.0023; N=43; differences between treatments: PR and C: P=0.0011; NR and PR: P=0.021; NR and C: P=0.23. (b) Number of food balls collected per nest in 5 h videos post-treatment (GLMM: overall effect of treatment: P=0.0037; N=43; difference between treatments: PR and C: P=0.011; NR and PR: P=0.039; NR and C: P=0.14). Boxes represent second and third quartiles with the median value indicated as a black line; whiskers stretch from lower to upper maximum values, except from outliers indicated as dots. Stars indicate significance levels from GLMMs: ‘*' indicates P<0.05; ‘**' indicates P<0.01

