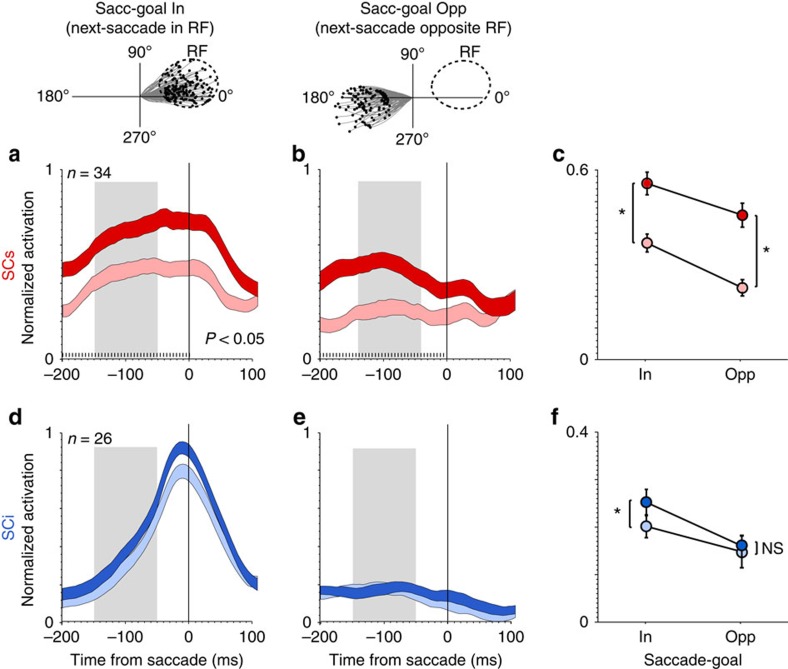
Figure 4. Behavioural dependence of SC saliency coding (saccade-aligned).
(a,b) Average normalized activation of SCs neurons associated with high (dark red) versus low (light red) saliency (upper versus lower tertiles), when next-saccades were directed in a versus b opposite the RF. (d,e) Average normalized activation of SCi neurons associated with high (dark blue) versus low (light blue) saliency, when next saccades were directed in d versus e opposite the RF. Shading along the response curves indicates ±1 s.e.m. Tick marks above the abscissa indicate significant differences between the response curves (5 ms bins, Wilcoxon paired-samples test, Bonferroni-Holm correction). (c,f) Average normalized activation within a pre-saccadic epoch (−150 to −50 ms) illustrated by the grey shaded regions in a,b,d and e). Error bars in c and f indicate ±1 s.e.m. *P<0.05, paired t-test; NS=not statistically significant.

