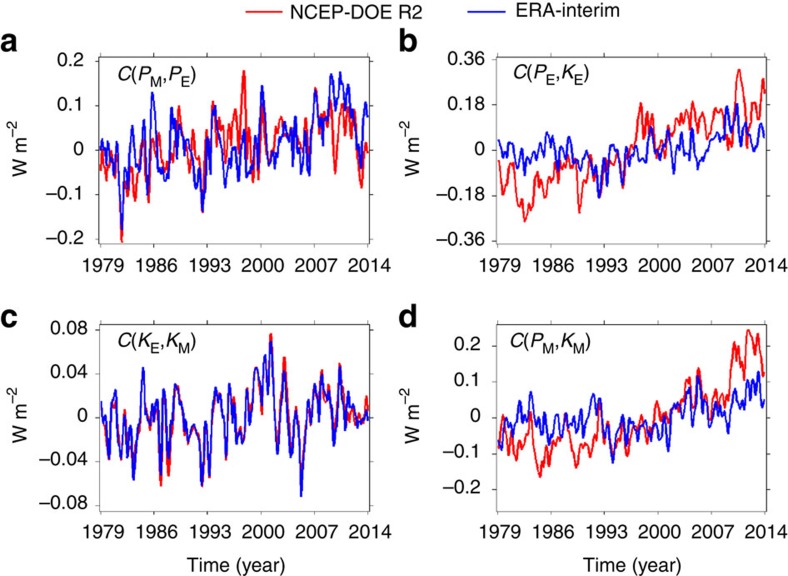
Figure 2. Time series of the global-average conversion rates.
(a) The conversion rate between the mean available potential energy and the eddy available potential energy C(PM, PE). (b) The conversion rate between the eddy available potential energy and the eddy kinetic energy C(PE, KE). (c) The conversion rate between the eddy kinetic energy and the mean kinetic energy C(KE, KM). (d) The conversion rate between the mean available potential energy and mean kinetic energy C(PM, KM).

