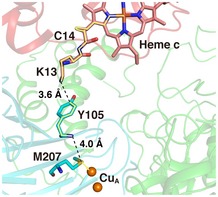
Figure 2. Electron transfer pathway in the Cyt.c–CcO complex.

The possible electron transfer (ET) pathway from the heme c iron to CuA was explored using the Pathways plugin for VMD (Humphrey et al, 1996; Balabin et al, 2012). Through‐bond processes and through‐space jumps are represented by yellow solid lines and black dashed lines, respectively. The heme c group and amino‐acid residues of Cyt.c molecule are shown as pink sticks. The amino‐acid residues of subunit II of CcO are shown as cyan sticks. Oxygen, nitrogen, and sulfur atoms are shown in red, blue, and yellow, respectively. Orange spheres indicate CuA. Protein structures are drawn by transparent ribbons in the same colors as those of Fig 1.
