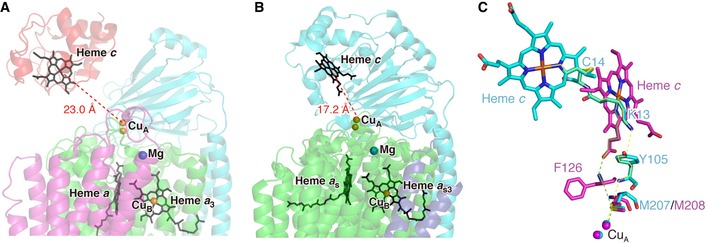
Figure EV2. Comparison of the Cyt.c–CcO complex with caa 3‐type CcO (Lyons et al, 2012).

-
A, BArrangement of redox cofactors in the Cyt.c–CcO complex (A) and caa 3‐type CcO (B). Heme groups (c, a, a 3, a s, and a s3) are shown as black sticks. Copper and magnesium ions are represented by orange and blue spheres, respectively. Distances from iron of heme c to CuA are indicated.
-
CComparison of ET pathways from iron of heme c to CuA between the Cyt.c–CcO complex (cyan sticks and yellow lines) and caa 3‐type CcO (magenta sticks and green lines). Both structures are superposed with their CuA‐containing domains. Solid and dashed lines represent through‐bond and through‐space processes, respectively.
