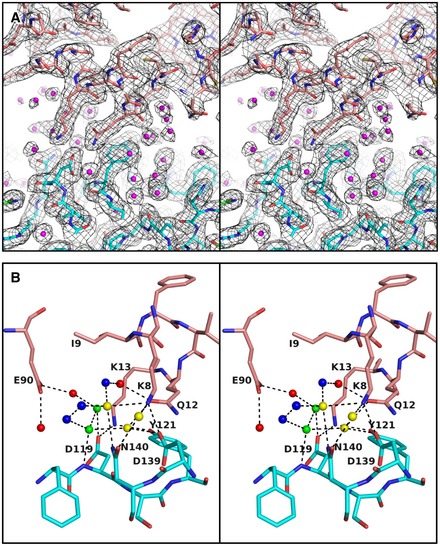
Figure EV3. Structure of waters around the direct interaction region between Cyt.c and CcO.

- Stereoscopic view of the 2(F o–F c) map of the Cyt.c–CcO complex, drawn at the 1.0 σ level. Each water molecule is clearly assigned in the map.
- Stereoscopic view of water structure. Each water molecule is drawn in the same color as in Fig 4A. Hydrogen bond networks consisting of water molecules including non‐interacting waters link Cyt.c and CcO.
