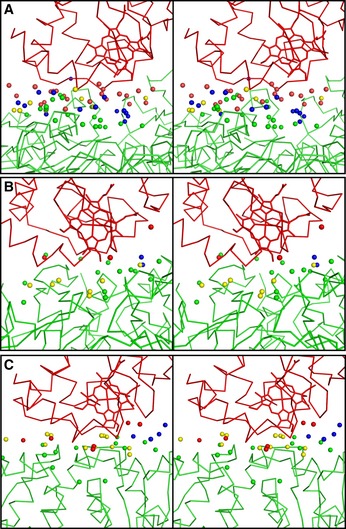
Figure 4. Comparison of the distribution of water molecules between Cyt.c and each redox partner.

-
A–CStereo views of water molecules between proteins in Cyt.c–CcO (A), Cyt.bc 1–Cyt.c (PDB 3CX5) (B), and Cyt.c–CcP complexes (PDB ID 4GED) (C). Bridging and non‐interacting waters are shown in yellow and blue, respectively. Non‐bridging waters interacting with Cyt.c are red spheres, and that interacting with redox partners are shown in green. Cyt.c and the redox partners are shown by wire models in red and green, respectively.
