
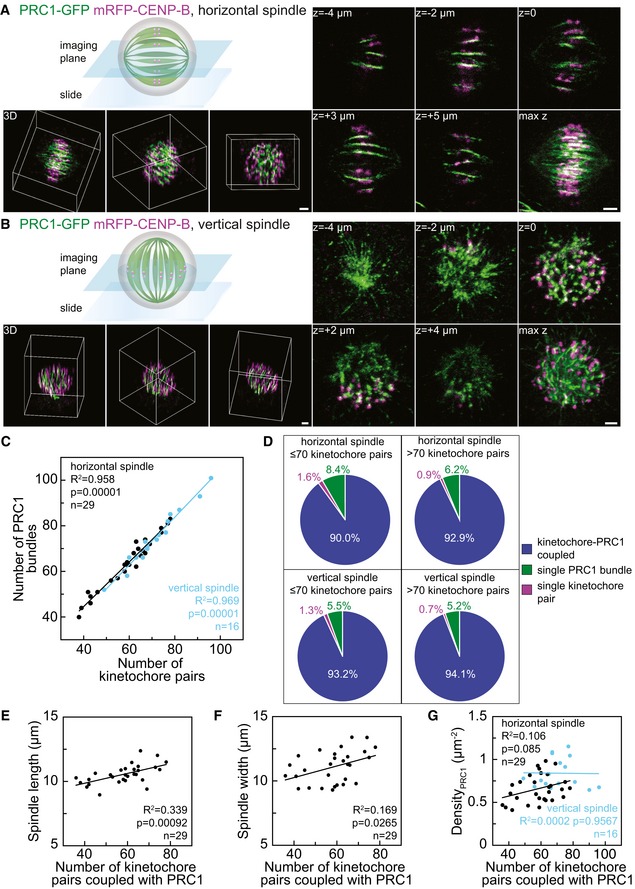
Figure 1. Most PRC1‐labeled overlap bundles are coupled with sister kinetochores in metaphase.
-
ASpindle in a fixed HeLa cell expressing PRC1‐GFP (green) and mRFP‐CENP‐B (magenta) oriented horizontally with respect to the imaging plane, as shown in the scheme. Images of different z‐slices (central plane of the spindle z = 0, two images below, z = −4 μm and z = −2 μm, and above, z = +3 μm and z = +5 μm), maximum projection of a z‐stack (max z), and 3D projections (3D) with the 3D coordinate system represented as a cuboidal box that indicates different spindle orientations are shown. Additional z‐slices of this spindle are shown in Fig EV1A.
-
BSpindle in a fixed HeLa cell expressing PRC1‐GFP (green) and mRFP‐CENP‐B (magenta) oriented vertically with respect to the imaging plane, as shown in the scheme. Legend as in (A). Additional z‐slices of this spindle are shown in Fig EV1B.
-
CCorrelation between the number of PRC1‐labeled bundles and the number of pairs of sister kinetochores counted throughout horizontal (black) and vertical (blue) spindles of fixed HeLa cells in metaphase. Data points represent individual spindles, lines show linear fits.
-
DPie charts showing the fraction of PRC1‐labeled bundles associated with kinetochore pairs (blue), PRC1‐labeled bundles not associated with kinetochores (green) and kinetochores not associated with PRC1 bundles (magenta) in horizontal (top row) and vertical spindles (bottom row) from cells with up to 70 chromosomes (left column) and more than 70 chromosomes (right column). Horizontal spindles contained a total of 1,786 kinetochore‐PRC1 pairs (n = 29 cells) and vertical spindles 1,133 kinetochore‐PRC1 pairs (n = 16 cells).
-
E, FSpindle length and spindle width as a function of the number of kinetochore pairs coupled with PRC1‐labeled bundles.
-
GNumber of kinetochore pairs coupled with PRC1‐labeled bundles per unit area of the cross section of the central part of horizontal (black) and vertical (blue) spindles as a function of the number of kinetochore pairs coupled with PRC1‐labeled bundles in the spindle.