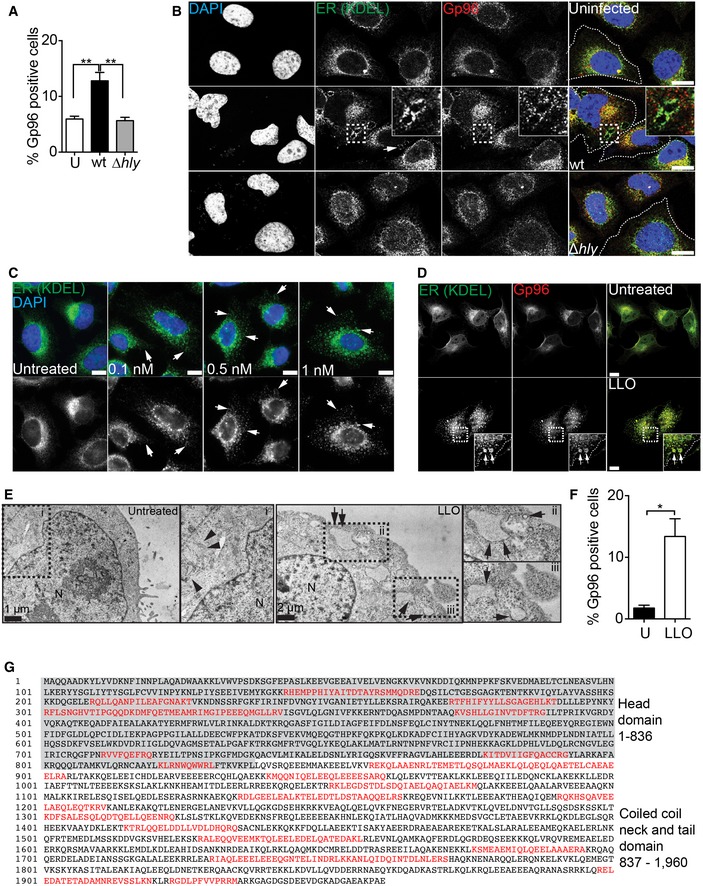
Flow cytometry analysis of surface‐exposed Gp96 levels in HeLa cells left uninfected (U) or infected with wt or ∆hly Lm for 1 h. Values are mean ± SEM (n ≥ 3), and P‐values were calculated using one‐way ANOVA with Tukey's post hoc analyses, **P < 0.01
Confocal microscopy images of HeLa cells left uninfected or infected with wt or ∆hly Lm for 1 h, fixed and immunolabelled for ER‐KDEL (green) and Gp96 (red) and stained with DAPI (blue). Insets show ER‐Gp96 vacuoles. Arrows indicate ER‐KDEL vacuoles. Scale bars, 10 μm.
Confocal microscopy images of HeLa cells left untreated or treated with the indicated concentrations of LLO for 15 min, fixed and immunolabelled for ER‐KDEL (green) and stained with DAPI. Arrows indicate ER‐KDEL vacuoles. Scale bars, 10 μm.
Confocal microscopy images of HeLa cells left untreated or treated with 0.5 nM LLO for 15 min and immunolabelled for Gp96 (red) and ER‐KDEL (green). Arrows indicate ER‐Gp96 vacuoles shown enlarged in the insets 1 and 2. Scale bars, 10 μm.
TEM images of HeLa cells left untreated or treated with 0.5 nM LLO for 15 min. Arrowheads indicate normal ER cisternae, and arrows show ER vacuoles at the proximity of PM.
Flow cytometry analysis of surface‐exposed Gp96 levels in HeLa cells left untreated (U) or treated with 0.5 nM LLO for 15 min. Values are mean ± SEM (n ≥ 3), and P‐values were calculated using two‐tailed unpaired Student's t‐test, *P < 0.05
Amino acid sequence of the human NMHCIIA with functional domains indicated. Peptide sequences recovered from MS/MS are highlighted in red.

