-
A, B
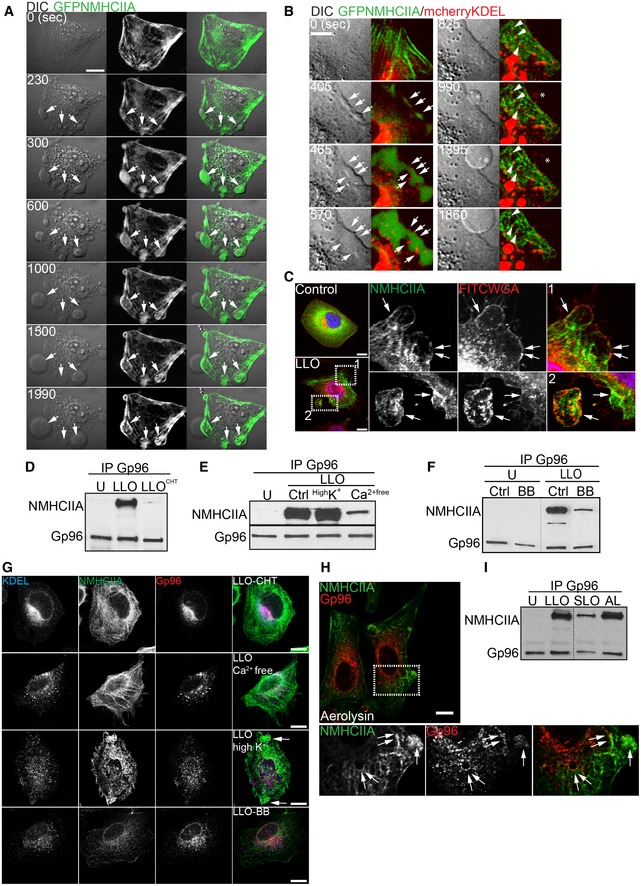
Sequential frames of time‐lapse confocal microscopy sequence of LLO‐treated HeLa cells expressing (A) GFPNMHCIIA or (B) simultaneously GFPNMHCIIA and mcherryKDEL. LLO was added to culture medium 10 s before t
0. DIC, differential interference contrast. (A) Arrows indicate NMHCIIA bundles at PM blebbing sites. (B) Highlights depicting ER structures within NMHCIIA bundles and PM blebs. Arrows indicate cortical ER surrounding NMHCIIA accumulations, arrowheads indicate contact points between ER vesicles and NMHCIIA cables, and asterisks point to ER vacuoles within PM blebs.
-
C
Confocal microscopy images of HeLa cells left untreated (control) or treated with LLO (0.5 nM, 15 min). Cells were stained with FITCWGA (plasma membrane, PM;red) and immunolabelled for NMHCIIA (green). Insets show PM blebs and arrows indicate recruitment of NMHCIIA bundles to PM blebs associated (1) or detached (2) from the cell body.
-
D–F
Immunoblots of Gp96 and NMHCIIA levels from Gp96 IP of HeLa cells left untreated (U) or treated with LLO (0.5 nM, 15 min) (LLO) and (D) LLO pre‐incubated with cholesterol (LLOCHT); (E) LLO in medium supplemented with 140 mM K+ (HighK+) and LLO in Ca2+‐free medium (Ca2+free); (F) LLO in the presence of 25 μM blebbistatin (BB).
-
G
Confocal microscopy images of HeLa cells treated as indicated and immunolabelled for ER‐KDEL (blue), NMHCIIA (green) and Gp96 (red). Arrows indicate NMHCIIA bundles.
-
H
Confocal microscopy images of HeLa cells treated with aerolysin and immunolabelled for NMHCIIA (green) and Gp96 (red). Insets show NMHCIIA bundles and arrows indicate association between Gp96 and NMHCIIA.
-
I
Immunoblots of NMHCIIA and Gp96 levels from Gp96 IP of HeLa cells left untreated (U) or treated with LLO (0.5 nM, 15 min), SLO (1.5 μg/ml, 30 min) (SLO) or aerolysin (0.2 nM, 40 min) (AL).
Data information: All scale bars are 10 μm. See also
.

