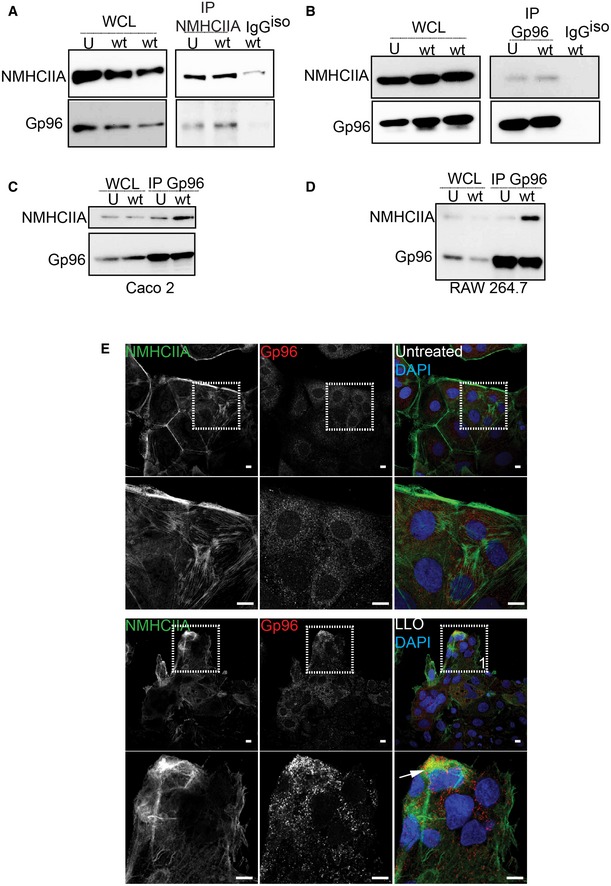
Figure EV2. NMHCIIA–Gp96 interaction and association at cortical structures in HeLa, Caco‐2 and RAW 264.7 cells infected with Listeria monocytogenes or treated with LLO .

-
A–DImmunoblots of NMHCIIA and Gp96 levels from whole‐cell lysates (WCL) and (A) NMHCIIA IP or (B–D) Gp96 IP fractions from (A, B) HeLa cells, (C) Caco‐2 cells or (D) RAW264.7 macrophages left uninfected (U) or infected with wt Lm for 1 h, probed with anti‐Gp96 and anti‐NMHCIIA antibodies. (A, B) Control IP was carried out using unspecific isotype antibodies (IgGiso).
-
EConfocal microscopy images of Caco‐2 cells left untreated or treated with 0.5 nM LLO for 15 min, immunolabelled for NMHCIIA (green) and Gp96 (red) and stained with DAPI (blue). Arrows indicate Gp96‐positive NMHCIIA cortical structures. Scale bars, 10 μm.
