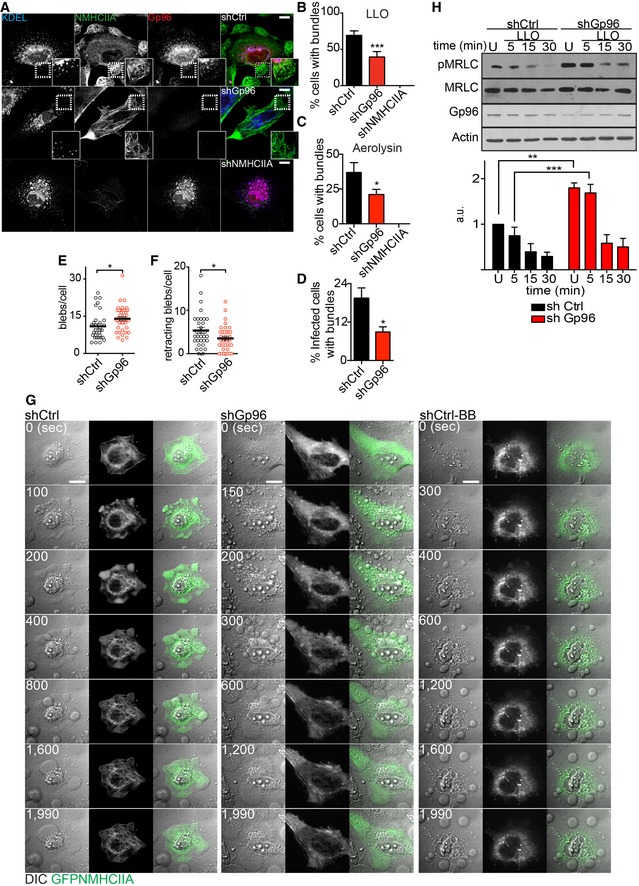
Figure 3. Gp96 controls NMHCIIA remodelling and PM blebbing in response to PFTs.

-
AConfocal microscopy images of shCtrl, shGp96 or shNMHCIIA HeLa cells treated with LLO (0.5 nM, 15 min) and immunolabelled for KDEL proteins (blue), NMHCIIA (green) and Gp96 (red). Insets show compact NMHCIIA bundles in shCtrl cells and dispersed NMHCIIA bundles in shGp96 cells. Scale bar, 10 μm.
-
B–DQuantification of the percentage of cells harbouring NMHCIIA bundles after incubation with (B) LLO (0.5 nM, 15 min), (C) aerolysin (0.2 nM, 40 min) or (D) wt Listeria monocytogenes. Values are the mean ± SEM (n ≥ 3); P‐values were calculated using (B, C) one‐way ANOVA with Dunnett's post hoc analyses and (D) two‐tailed unpaired Student's t‐test, *P < 0.5, ***P < 0.001. For shNMHCIIA, bundles were detected following actin staining (Fig EV3C).
-
E, FNumber of (E) blebs per cell or (F) retracting blebs per cell evaluated by time‐lapse microscopy analysis of LLO‐treated shCtrl or shGp96 cells. shCtrl n = 32 cells and shGp96 n = 40 cells; P‐values were calculated using two‐tailed unpaired Student's t‐test, *P < 0.5.
-
GSequential frames of time‐lapse microscopy analysis of LLO‐treated HeLa cells expressing GFPNMHCIIA [shCtrl, shGp96 and shCtrl with 25 μM blebbistatin (shCtrl‐BB)]. LLO was added to culture medium 10 s before t 0. Scale bar, 10 μm.
-
HImmunoblots of Ser19‐phosphorylated MRLC (pMRLC), MRLC and actin levels from shCtrl or shGp96 cells left untreated (U) or treated with 0.1 nM LLO for the indicated time points. Quantification of pMRLC levels corresponds to the mean ± SEM (n ≥ 3); P‐values were calculated using one‐way ANOVA with Tukey's post hoc analyses, **P < 0.01, ***P < 0.001.
