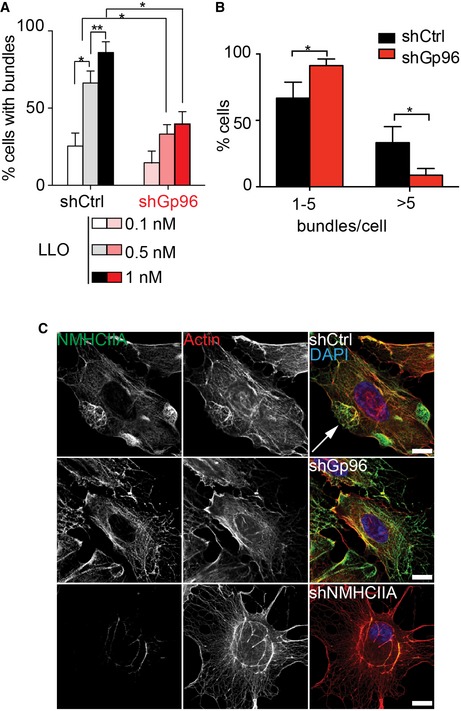
Quantification of the percentage of shControl and shGp96 HeLa cells harbouring NMHCIIA bundles in response to increasing concentrations of LLO.
Quantification of the percentage of shCtrl and shGp96 HeLa cells harbouring at least 1–5 or > 5 NMHCIIA bundles per cell in response to 0.5 nM LLO (15 min).
Confocal images of shCtrl, shGp96 or shNMHCIIA HeLa cells treated with 0.5 nM LLO for 15 min and immunolabelled for NMHCIIA (green) and stained with phalloidin (actin, red) and DAPI (blue). Arrow indicates compact actomyosin cortical bundle. Scale bars, 10 μm.
Data information: For all quantifications, values are mean ± SEM (
n ≥ 3) and
P‐values were calculated using one‐way ANOVA with Tukey's
post hoc analyses, *
P < 0.05, **
P < 0.01.

