-
A
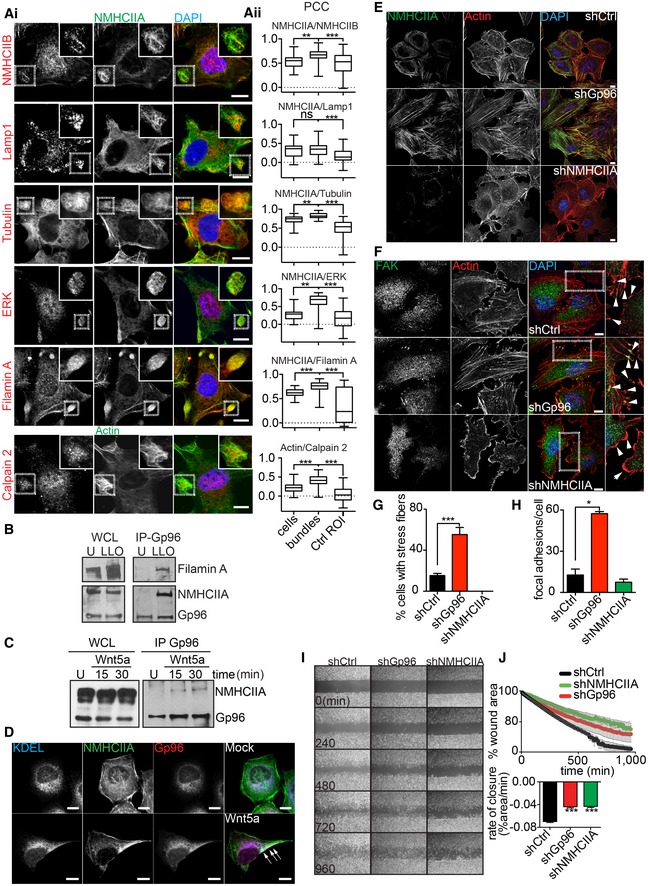
Confocal microscopy images (i) of LLO‐treated HeLa cells immunolabelled for the indicated proteins. Insets show co‐localization between NMHCIIA and WRAMP components at cortical bundles. (ii) Quantification of Pearson's correlation coefficient (PCC) between NMHCIIA and the indicated proteins within entire LLO‐treated cells, cortical bundles or equivalent‐size control cellular ROI (Ctrl ROI). For calpain 2, cortical bundles were defined by actin staining. Data are representative of one experiment repeated three independent times with similar results. The boxes extends from the 25th to 75th percentiles. The whiskers are min to max and the horizontal line is plotted at the median.
-
B
Immunoblots of NMHCIIA, Gp96 and filamin A levels from WCL and Gp96 IP of HeLa cells left untreated (U) or treated with LLO (0.5 nM, 15 min) (LLO).
-
C
Immunoblots of NMHCIIA and Gp96 levels from WCL and Gp96 IP of HeLa cells left untreated (U) or treated with 25 μg/ml of Wnt5a for the indicated time.
-
D
Confocal microscopy images of HeLa cells untreated (Mock) or treated with 25 μg/ml of Wnt5a for 30 min. Cells were immunolabelled for ER‐KDEL (blue), Gp96 (red) and NMHCIIA (green). Arrows indicate polarized localization of NMHCIIA, ER‐KDEL and Gp96 in Wnt5a‐treated cells.
-
E, F
Confocal microscopy images of shCtrl, shGp96 or shNMHCIIA HeLa cells stained for actin (red) and DAPI (blue) and immunolabelled for (E) NMHCIIA (green) or (F) focal adhesion kinase (FAK) (green). Insets in (F) show sites with focal adhesion points indicated by arrows.
-
G, H
Quantification of the percentage of cells with (G) stress fibres or (H) focal adhesion points labelled by FAK.
-
I, J
Wound closure assay. (I) Sequential frames of time‐lapse microscopy of HeLa cells grown to confluence separated by a stopper. Stopper was removed at t
0 and cellular migration was imaged for the indicated times. (J) Quantification of the percentage of wound area occupied by migrating cells over time, stopper removal (upper panel), and respective rate of closure (lower panel).
Data information: Scale bars, 10 μm. Data in (G, H and J) are the mean ± SEM (
n ≥ 3).
P‐values were calculated using one‐way ANOVA with Tukey's
post hoc analyses (A) or Dunnett's
post hoc analyses (G, H and J), *
P < 0.05, **
P < 0.01, ***
P < 0.001, ns, non‐significant. See also Fig
EV4.

