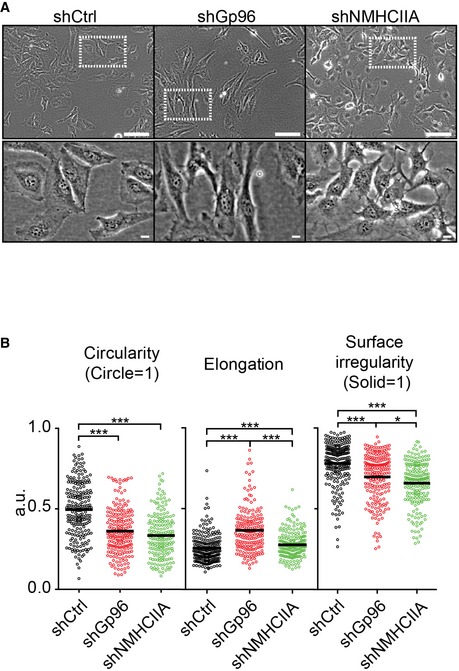
Figure EV4. Gp96 and NMHCIIA modulate cell shape.

- Brightfield images of the indicated unfixed HeLa cell lines used for analysis of shape indicators. Scale bars: 100 and 10 μm for top and bottom panels, respectively.
- Quantification of cellular shape indicators. Each point represents one individual cell imaged and analysed for each parameter in each sample. At least 190 cells were analysed. P‐values were calculated using one‐way ANOVA with Tukey's post hoc analyses, *P < 0.05, ***P < 0.001.
