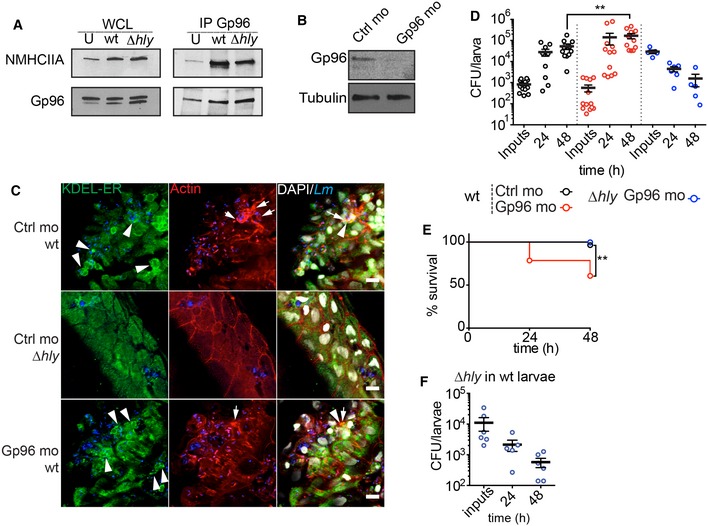
Immunoblots of NMHCIIA and Gp96 levels from whole‐cell lysates (WCL) and IP fractions (IP Gp96) of extracts of zebrafish larvae 3 dpf uninfected (U) or infected with wt or ∆hly Lm (low dose, 200–1,500 CFU) for 24 h.
Immunoblots of Gp96 and tubulin levels from zebrafish 3 dpf larvae injected with control (Ctrl mo) or Gp96 morpholino oligonucleotides (Gp96 mo).
Confocal microscopy images of zebrafish larvae (Ctrl mo or Gp96 mo) infected (low dose) in the tail muscle with the GFP‐expressing wt or ∆hly Lm for 24 h, immunolabelled for KDEL proteins (green), and stained with phalloidin (actin, red) and DAPI (white). Images show actin‐rich structures at the cell cortex (arrows) and ER‐KDEL puncta (arrowheads) in larvae infected with wt strain. Scale bar, 10 μm.
CFU counts per zebrafish larva (Ctrl or Gp96 mo) infected with wt (low dose) or ∆hly (high dose, > 10,000 CFU) Lm and analysed at 0, 24 and 48 hpi. Results are mean ± SEM (n ≥ 3) (horizontal bars), and each circle represents one larva. P‐values were calculated using one‐way ANOVA with Tukey's post hoc analyses, **P < 0.01.
Survival curves of zebrafish larvae (Ctrl mo or Gp96 mo) infected with a wt (low dose) or ∆hly (high dose, > 10,000 CFU) Lm. Results are mean ± SEM (n ≥ 3). wt infection of Ctrl and Gp96 mo, n = 28 larvae; Δhly infection of Gp96 mo, n = 13. P‐values were calculated using log‐rank test, **P < 0.01.
CFU counts per zebrafish larva infected with a high dose of ∆hly Lm at different times post‐infection. Results are mean ± SEM (n ≥ 3) (horizontal bars); each point represents one larva.
.

