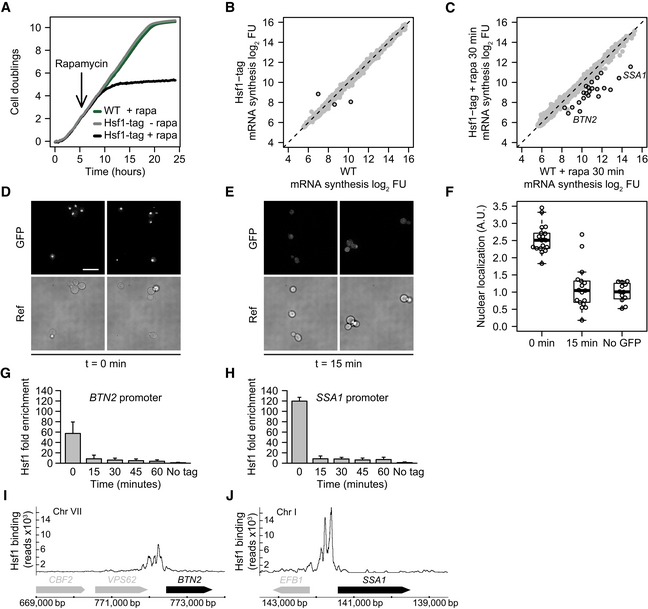
Figure 1. Dynamics of Hsf1 nuclear depletion.

-
AGrowth curves of WT and the HSF1 FRB‐GFP‐tagged strain with and without rapamycin, the inducing agent for nuclear depletion (Haruki et al, 2008). WT is the parental S288C/BY4742 strain for anchor‐away that has been genetically desensitized to rapamycin.
-
BScatterplot of 4tU‐derived mRNA synthesis in the Hsf1‐tagged strain compared to WT. The x‐ and y‐axes plot the log2 fluorescent dye intensities of the microarray probes representing each gene (dots), averaged over four replicates. Black circles indicate genes with significantly altered synthesis (FC > 1.7 and P < 0.01, calculated using limma).
-
CmRNA synthesis, 30 min after induction of Hsf1 nuclear depletion versus same treatment in WT. Black circles indicate genes with significantly decreased synthesis (FC > 1.7 and P < 0.01, calculated using limma).
-
DFluorescence microscopy images of Hsf1‐FRB‐GFP at t = 0 for induced depletion. Scale bar: 10 μm.
-
EFluorescence microscopy images of Hsf1‐FRB‐GFP 15 min after induction of depletion.
-
FBoxplot showing the quantification of Hsf1 depletion from the nucleus. Dots represent individual cell measurements. Solid horizontal lines show the median, the box represents the interquartile range and the whiskers are at the most extreme data point no further away from the closest quartile than 1.5 times the interquartile range.
-
G, HDynamics of Hsf1 depletion from the SSA1 promoter (SAGA‐dominated) and BTN2 promoter (TFIID‐dominated), as measured by ChIP‐qPCR. Error bars show the standard deviation of four independent replicates.
-
I, JHsf1 binding to the SSA1 and BTN2 promoters as measured by ChIP‐seq.
