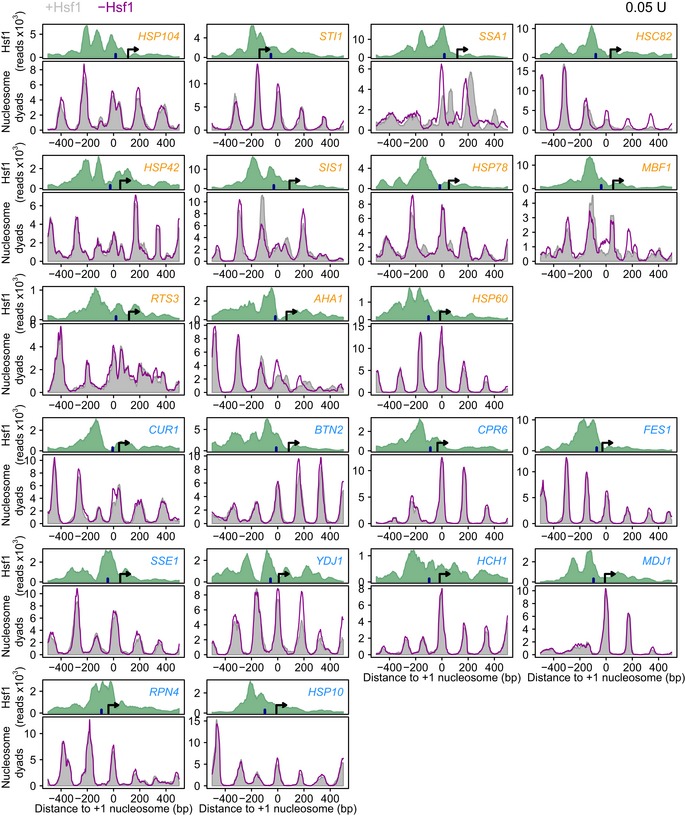
Figure EV2. Hsf1 removal results in nucleosomal repositioning on SAGA‐dominated promoters.

MNase‐seq nucleosomal DNA midpoint mapping with and without Hsf1 for all 11 SAGA‐dominated targets (orange) and all 10 TFIID‐dominated targets (blue). The arrow denotes the transcriptional start site (Nagalakshmi et al, 2008). The dark blue bar indicates the location of the TATA(‐like) element (Rhee & Pugh, 2012). For STI1 either the TATA‐box or the start site is likely incorrectly called. All the tracks are aligned to the +1 nucleosome. These tracks were used to create the average plot shown in Fig 6.
