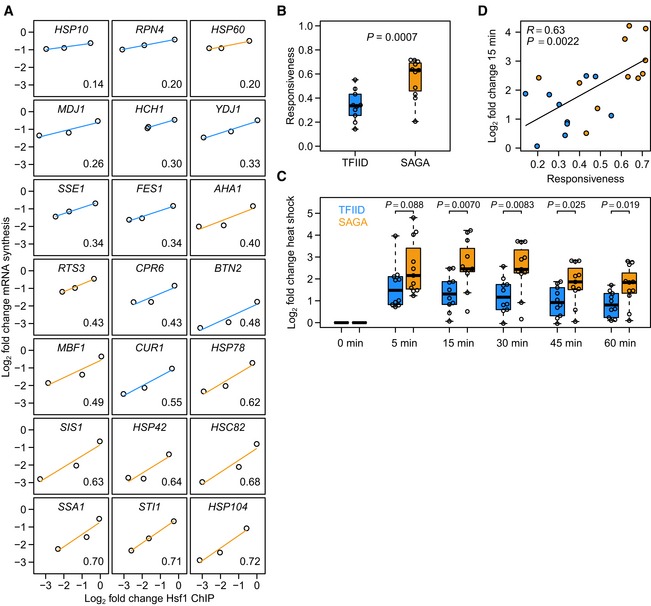
Figure 4. SAGA‐dominated Hsf1 targets are more responsive than TFIID‐dominated Hsf1 targets.

- Responsiveness (measured as the slope of the line fit to Hsf1 binding change versus mRNA synthesis change) of Hsf1 targets ordered from low to high. Blue lines are TFIID‐regulated genes and orange lines are SAGA‐regulated genes. The responsiveness of each target is shown in the bottom right corner.
- Boxplot of responsiveness values shown in (A). The P‐value was calculated using a linear model with the log2 binding ratio as a continuous covariate. Solid horizontal lines show the median, the box represents the interquartile range and the whiskers are at the most extreme data point no further away from the closest quartile than 1.5 times the interquartile range.
- Log2 fold expression changes of the TFIID‐dominated (blue) and SAGA‐dominated (orange) Hsf1 targets in response to heat shock. To determine the significance of difference in upregulation between the two promoter classes, P‐values were calculated using a two‐sided t‐test. Each time point was grown as biological replicate and measured in technical replicate, yielding four measurements per gene.
- Expression changes upon 15 min of heat shock versus the responsiveness of the direct Hsf1 targets. Colours are the same as in (A). Heat‐shock expression data were taken from O'Duibhir et al (2014). R‐ and P‐values were calculated using the function “cor.test” in the statistical language R. Fig EV1 encompasses additional analyses of responsiveness.
