
Figure 6. Hsf1 removal results in nucleosomal repositioning on SAGA‐dominated promoters.
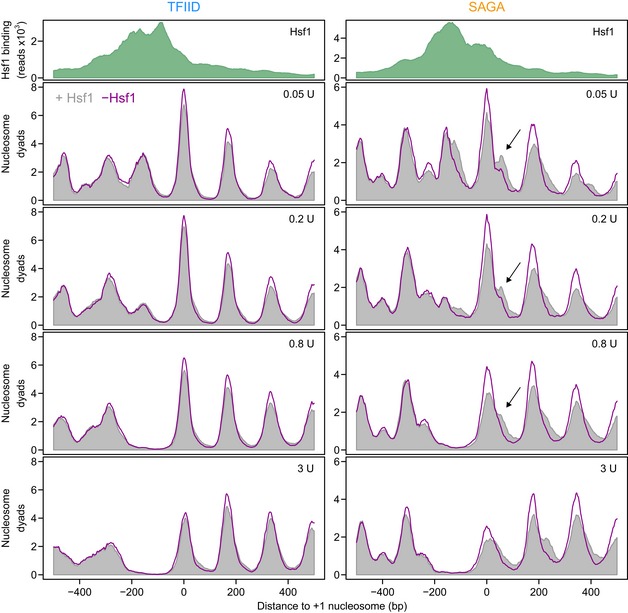
Average profiles of MNase‐seq nucleosomal DNA midpoint positions for the TFIID‐dominated (left) and SAGA‐dominated (right) Hsf1 targets. The upper panels display the average Hsf1 binding by ChIP‐seq (green). The lower panels show nucleosomal DNA midpoints using 31 bp smoothing in the presence (grey) and absence (purple line) of Hsf1 (30 min of nuclear depletion). Each profile is the average of three biological replicates each scaled to 10 million mapped reads. The values in the top right corner indicate the amount of MNase used to digest the chromatin. The data are aligned to the +1 nucleosome. The arrows indicate the downstream +1 nucleosome in the SAGA‐dominated promoters, that shifts upstream upon depletion of Hsf1.