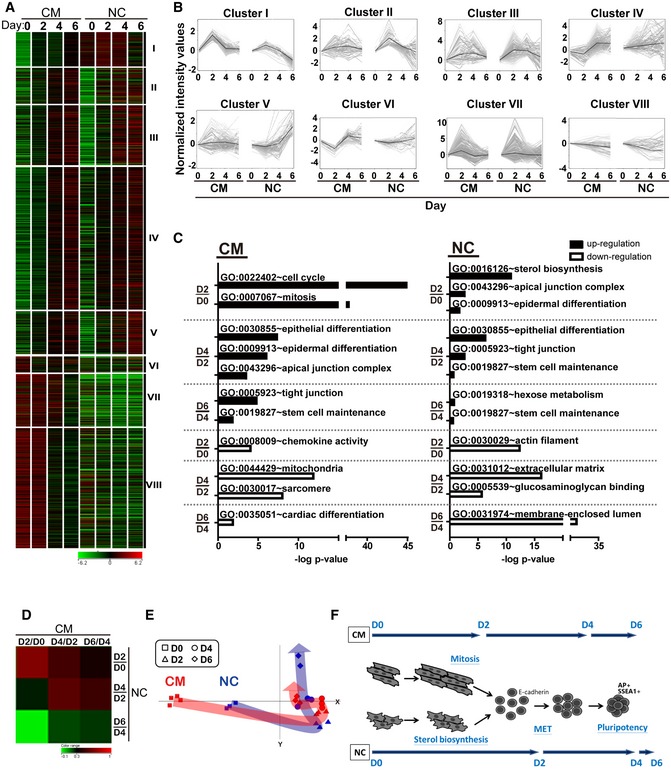
Figure 2. Microarray analysis of early CM reprogramming process compared to NCs.

- Gene profiling of CM and NC at D0–D6 as shown clustered into eight categories. Red indicates up‐regulated genes while green indicates down‐regulated genes (n = 3, n = 2 for NC‐D6).
- Expression patterns of all genes per cluster by gray lines. Black line shows the mean value.
- Gene ontological analysis of early reprogramming at different time points.
- Correlative analysis representing the relationships between CM and NC reprogramming specifically at days 2, 4 and 6. Red indicates closely related groups, while green indicates significantly different groups.
- Principle component analysis (PCA) analysis indicating the routes during early reprogramming of CMs and NCs.
- Schematic showing early reprogramming processes of CMs and NCs.
