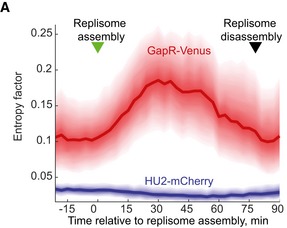
Figure EV4. Population analysis of GapR and HU2 spatial organization during the cell cycle.

Plot showing how the spatial distribution of GapR‐Venus and HU2‐mCherry deviates from their theoretical maximum entropy values, with the greater the values are, the more organized (the least dispersed) the signal is. In this plot, maximum entropy (uniform distribution) corresponds to an organization factor value of zero. The data were obtained from time‐lapse experiments of CJW5932 (n = 752) or CJW5969 (n = 579) cells and were computationally synchronized by maximizing the correlation in DnaN‐CFP signal dynamics. See Code EV3 information for details about the calculation of the organization factor.
