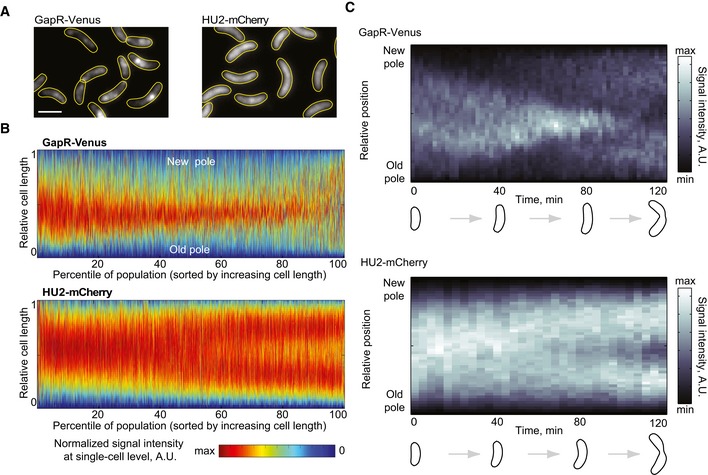
Figure 5. GapR localization changes during the cell cycle.

- Fluorescence images of an asynchronous population expressing GapR‐Venus (CJW5800) or HU2‐mCherry (CJW5806). Scale bar = 2 μm.
- Demographs of asynchronous populations (n = 2,700 cells) showing the cell cycle localization of GapR‐Venus (strain CJW5800) or HU2‐mCherry (strain CJW5806). Each fluorescent profile across the cell was normalized by cell length. Cells were sorted by increasing cell length. Cell coordinates in the GapR‐Venus demograph were oriented using new‐pole marker TipN‐CFP.
- Kymographs of a time‐lapse experiment showing a cell producing either GapR‐Venus (strain CJW5535) or HU2‐mCherry (strain CJW5960). The identity of the cell poles was determined by using new‐pole markers FtsZ‐CFP (for the gapR‐venus‐expressing strain) or TipN‐CFP (for the hu2‐mcherry‐expressing strain). The schematics show cell outlines from the Oufti software.
