
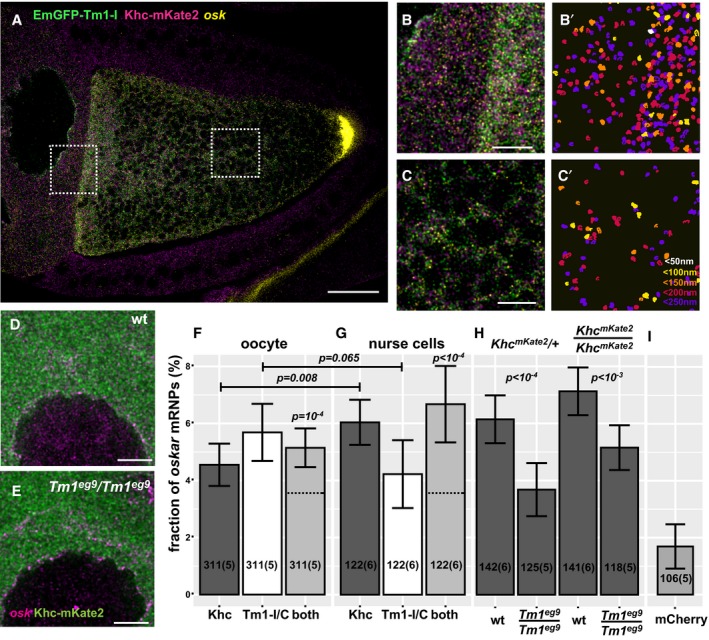
Figure 5. Composition of oskar mRNPs in situ .
-
A–C′Confocal image of a Tm1 eg9 homozygous egg‐chamber expressing EmGFP‐Tm1‐I (green) and Khc‐mKate2 (magenta). oskar mRNA labelled with osk1‐5 FIT probes (Hovelmann et al, 2014) is in yellow. (B′, C′) oskar mRNPs colocalizing with both EmGFP‐Tm1‐I and Khc‐mKate2. Colours indicate the maximal colocalization distance (C′). Panels (B–C′) represent the boxed regions in panel (A).
-
D, ELocalization of Khc‐mKate2 (green) and oskar mRNA (magenta) in wild‐type and Tm1 gs‐mutant nurse cells.
-
F, GFraction of oskar mRNPs colocalizing with Khc‐mKate (dark grey), EmGFP‐Tm1‐I (white) or both of these proteins (light grey) in the oocyte (F) or in the nurse cells (G) (max. colocalization distance is 250 nm). None of the values are significantly different from each other (one‐way ANOVA, P > 10−3). Horizontal dashed lines indicate the expected value of observing both proteins in an oskar mRNP if the interactions are independent (see Fig EV3C and D). Significance of the observed colocalization values versus the expected values is shown (one‐sample t‐test). Data obtained from nurse cells and oocytes were compared with pairwise t‐test.
-
HFraction of oskar mRNPs colocalizing with Khc‐mKate in wild‐type and Tm1 gs‐mutant nurse cells when half or all Khc molecules are labelled (as indicated above the graph). P‐values of pairwise t‐tests are indicated.
-
IFraction of oskar mRNPs colocalizing with free mCherry in wild‐type nurse cells used as negative control. The measured fraction (˜1.6%) is significantly different from zero (one‐sample t‐test). All other measured colocalization values are significantly different from this negative control (P < 0.001, one‐way ANOVA).