
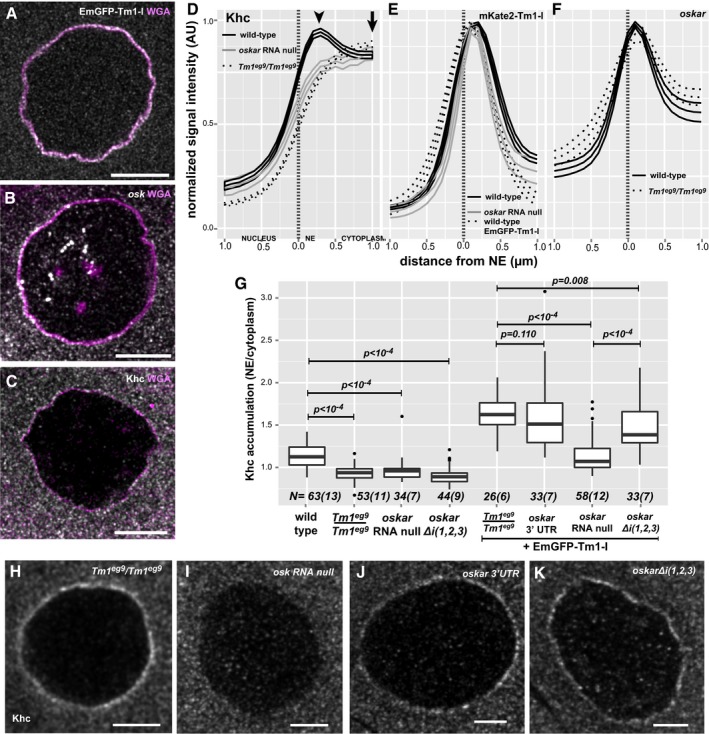
Figure 6. Accumulation of oskar mRNPs around the NE.
-
A–CLocalization of EmGFP‐Tm1‐I (A), oskar mRNA (B) and Khc (C) around the nurse cell nuclear envelope (magenta, WGA staining).
-
D–FMean distribution profile of Khc (D) mKate2‐Tm1‐I, EmGFP‐Tm1‐I (E) and oskar mRNA (F) around the NE of nurse cells (marked with a dotted vertical line). Genotypes are indicated as follows: wild‐type control with solid black line (D–F), oskar RNA null with solid grey line (D, E) and Tm1 eg9/Tm1 eg9 with dotted black line (D, F). Lines indicate mean and 95% confidence intervals. We analysed the accumulation of mKate2‐Tm1‐I instead of EmGFP‐Tm1‐I due to unexpected GFP expression from the oskar 0 allele.
-
GKhc accumulation around the NE. To calculate accumulation, the signal intensity measured at the position of the peak observed in the wild‐type control (D, arrowhead, 356 ± 17.6 nm away from NE) was divided by the signal intensity 2 s.d. away (D, arrow, at 356 + 2*410 nm). P‐values of pairwise Mann–Whitney U‐tests against wild‐type control or Tm1 gs rescued with EmGFP‐Tm1‐I are indicated above the boxplots. Numbers indicate the number of nuclei and the number of egg‐chambers (in brackets) analysed. The bottom and the top of the box represent the first and third quartiles, the thick horizontal lines indicate the data median. Whiskers show the data range excluding outliers, which are represented by dots.
-
H–KKhc accumulation around the NE of nurse cells over‐expressing EmGFP‐Tm1‐I within Tm1 eg9/Tm1 eg9 (H), and oskar RNA‐null egg‐chambers (I) expressing either the oskar 3′UTR (J) or oskar Δi(1,2,3) (K).