
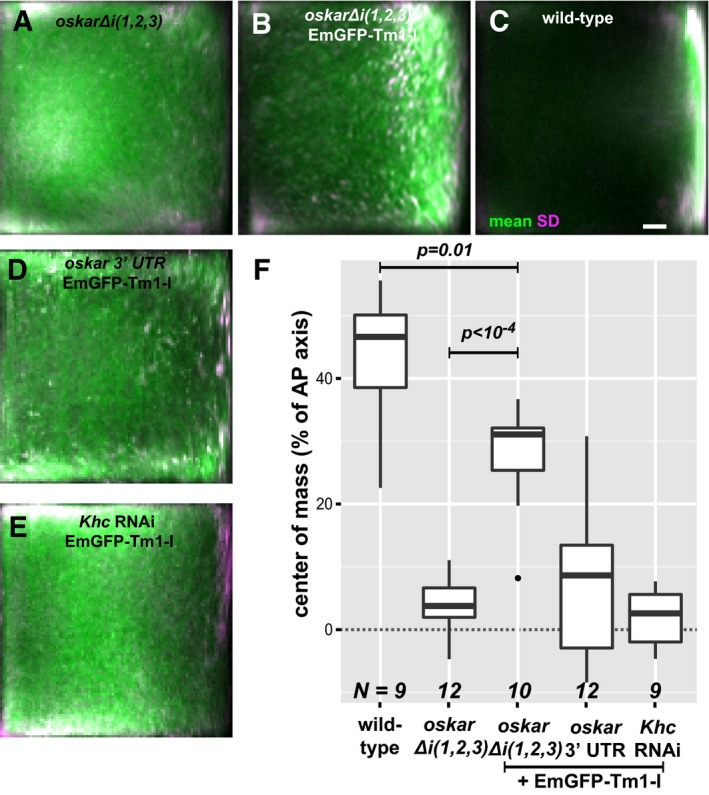
Figure 7. Effects of EmGFP‐Tm1‐I over‐expression on oskar mRNA localization.
-
A–EMean oskar mRNA distribution (green, detected by conventional FISH) within oocytes in which oskar mRNA is substituted by oskar Δi(1,2,3) mRNA (A, B) and oskar 3′UTR mRNA (D) and (in addition) over‐express EmGFP‐Tm1‐I (B, D and E). Wild‐type control (C) and oocytes expressing Khc RNAi and EmGFP‐Tm1‐I (E). Magenta indicates standard deviation of the distribution of oskar mRNA. Scale bar is 10% of total oocyte length (C).
-
FPosition of the oskar mRNA centre of mass relative to the geometric centre of the oocyte (dotted horizontal line) along the anteroposterior (AP) axis. Posterior pole is the top of the chart. P‐values of pairwise Mann–Whitney U‐tests are indicated. Numbers indicate the number of oocytes analysed. The bottom and the top of the box represent the first and third quartiles, the thick horizontal lines indicate the data median. Whiskers show the data range excluding outliers, which are represented by dots.