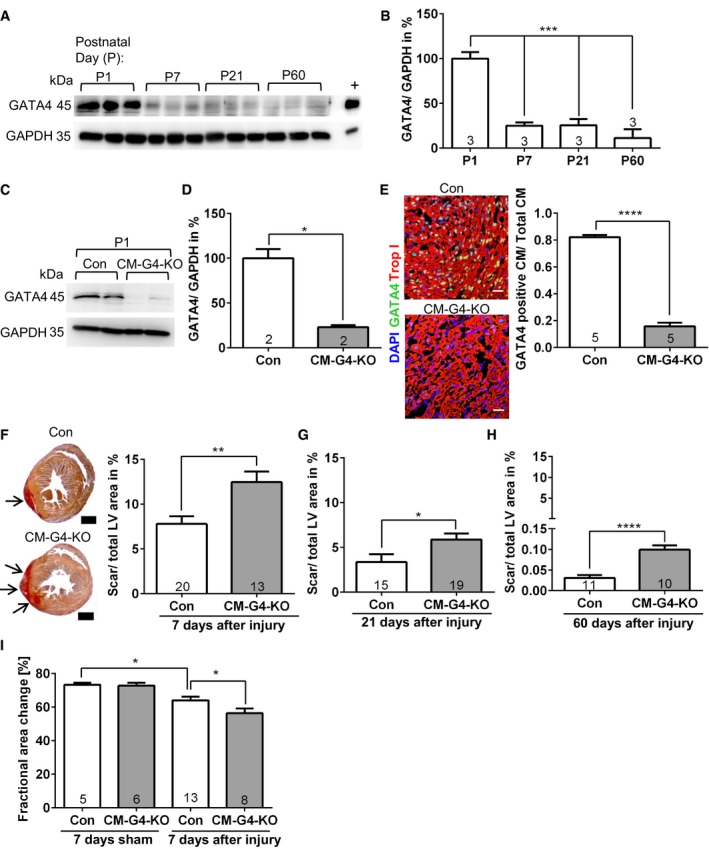
Cardiac GATA4 protein abundance analyzed by immunoblotting. GAPDH was the loading control. + denotes positive control for GATA4 from cardiomyocytes infected with a GATA4‐overexpressing adenovirus.
Densitometric quantification of the immunoblot shown in (A); ***P = 0.0003 for P1 vs. P7 and P1 vs. P21; ***P < 0.0001 for P1 vs. P60.
Immunoblot of cardiac GATA4 abundance in control (Con) and cardiomyocyte‐specific Gata4 knockout mice (CM‐G4‐KO) at postnatal day (P)1.
Quantification of the immunoblot shown in (C); *P = 0.018.
Cardiac immunofluorescence staining and its quantification from Con and CM‐G4‐KO mice at P1. Scale bars: 25 μm; ****P < 0.0001.
Transversal sections of mouse hearts 7 days after cryoinjury as indicated, stained with Sirius red. Scale bars: 500 μm. The quantification of the left ventricular (LV) scar area (red, arrows) 7 days after injury is shown on the right; **P = 0.0027.
The quantification of the LV scar area of the indicated mice 21 days after cryoinjury; *P = 0.0261.
The quantification of the LV scar area of the indicated mice 60 days after cryoinjury; ****P < 0.0001.
Echocardiographic analysis of left ventricular systolic function (measured as fractional area change) in the indicated mice 7 days after cryoinjury; *P = 0.033 between Con mice after sham or cryoinjury and *P = 0.04 between Con and CM‐G4‐KO mice after cryoinjury.
Data information: (B, D–I) The number within bars indicates the number of mice analyzed in that particular group. All data are expressed as mean ± SEM. Unpaired Student's
‐test (D–H) and one‐way ANOVA with Sidak's multiple comparisons test (B, I) were used to compare groups.

