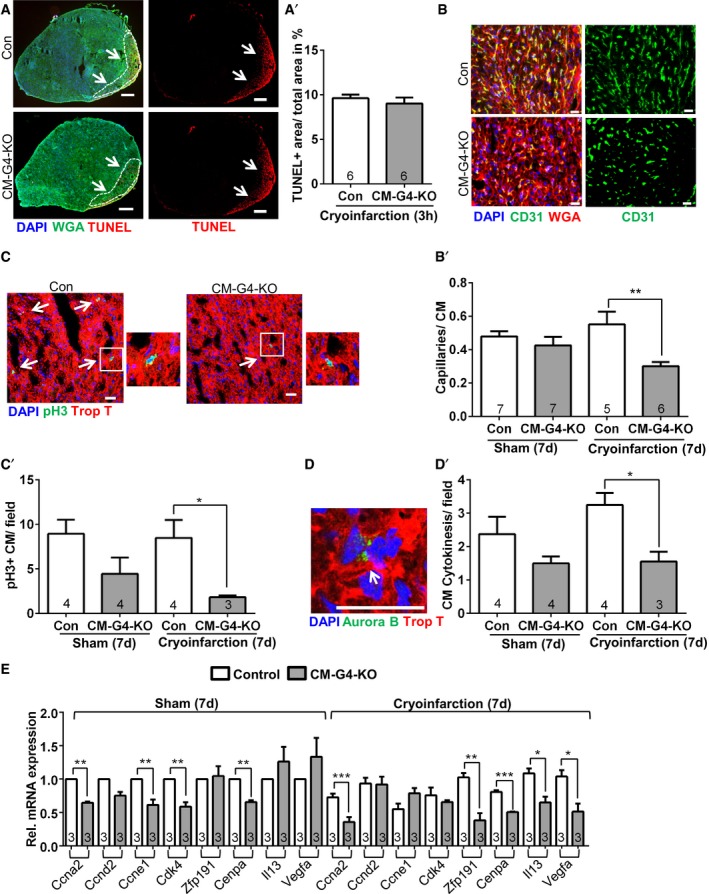
Representative pictures of TUNEL, WGA (wheat germ agglutinin to mark cardiomyocyte membranes), and DAPI immunofluorescence staining of mouse hearts as indicated. The white dashed line encircles the infarcted area (arrows). Scale bars: 200 μm. The quantification of the area of TUNEL‐positive cells 3 h after cryoinjury is shown on the right (A′).
Representative merged and single‐channel pictures of cardiac CD31, DAPI, and WGA immunostaining in mouse hearts as indicated. The quantification of the myocardial capillary density as capillaries/cardiomyocyte (CM) ratio 7 days (d) after cryoinjury or sham surgery is shown as bar graph (B′). Scale bars: 20 μm. **P = 0.0039.
Representative pictures of myocardial immunofluorescence staining for the mitosis marker phospho‐histone H3 (pH3), troponin T, and DAPI in mice as indicated. Enlarged pH3‐positive cardiomyocyte nuclei are shown separately. The arrows indicate pH3‐positive cardiomyocyte nuclei. Scale bars: 25 μm. The quantification of pH3‐positive (+) cardiomyocytes per microscopic field is shown as bar graph (C′); *P = 0.046.
Representative myocardial immunostaining for aurora B, DAPI, and troponin T (Trop T). The arrow points toward a cardiomyocyte cell division, in which aurora B localizes at the midbody in cytokinesis. Scale bar: 25 μm. The quantification of dividing cardiomyocytes per microscopic field is shown as bar graph (D′); *P = 0.0104.
Determination of cardiac gene expression by qPCR 7 days after sham or cryoinjury for the indicated genes; *P = 0.039 for Il13 and *P = 0.049 for Vegfa; **P = 0.0043 for Ccne1, **P = 0.0027 for Cdk4, **P = 0.0096 for Cenpa, **P = 0.0015 for Zfp191; ***P = 0.0009 for Ccna2, ***P = 0.0002 for Cenpa.
Data information: The number within bars indicates the number of mice analyzed in that particular group. All data are expressed as mean ± SEM. Unpaired Student's
‐test (A′) and one‐way ANOVA with Sidak's multiple comparisons test (B–E) were used to compare groups.