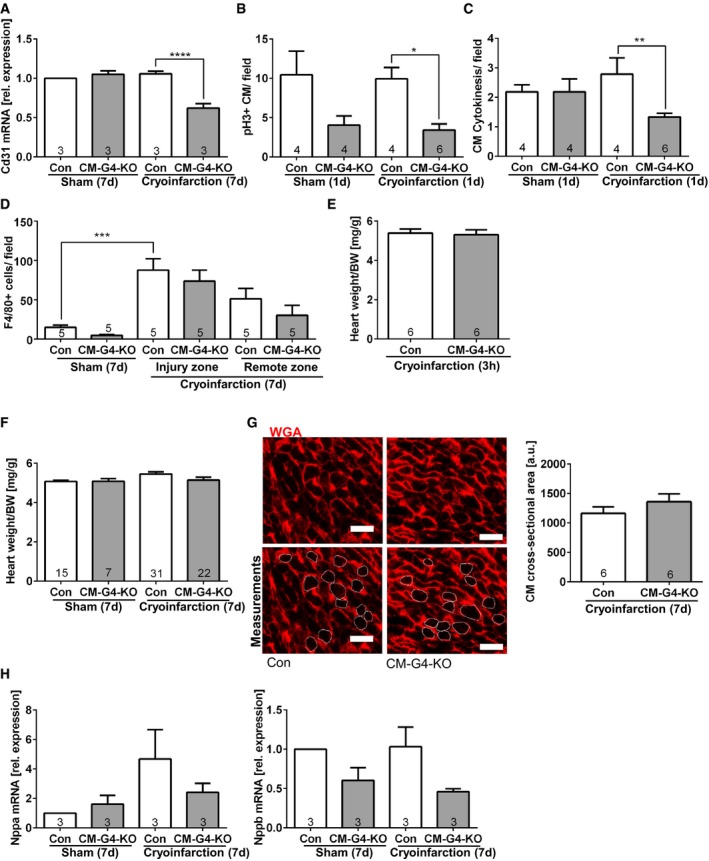
Cardiac Cd31 mRNA expression measured by qPCR in the indicated mice; ****P < 0.0001.
Quantification of pH3‐positive cardiomyocytes (CM) in mice 1 day (d) after sham or cryoinfarction as indicated; *P = 0.011.
Quantification of cardiomyocyte cell division in mice 1 day (d) after sham or cryoinfarction as indicated; **P = 0.0069.
Quantification of myocardial macrophage abundance (positive for F4/80) in the indicated mice 7 days after sham surgery or cryoinfarction. ***P = 0.0003.
Heart weight/body weight (BW) ratio in the indicated mice 3 h after cryoinfarction.
Heart weight/body weight ratio in the indicated mice 7 days after sham surgery or cryoinfarction.
Representative wheat germ agglutinin (WGA)‐stained myocardial sections for the quantification of cardiomyocyte (CM) cross‐sectional area assessed 7 days after cryoinfarction in the indicated mice. Scale bars: 20 μm. The lower two pictures contain encircled cardiomyocyte cross sections (by a fine white line) of which the area was determined to obtain the cross‐sectional area.
qPCR‐based determination of myocardial Nppa (known as ANP) and Nppb (BNP) mRNA expression as hypertrophic marker genes in mice as indicated.
Data information: The number within bars indicates the number of mice analyzed in that particular group. All data are expressed as mean ± SEM. Unpaired Student's
t‐test (E, G) and one‐way ANOVA with Sidak's multiple comparisons test (A–D, F, H) were used to compare groups.

