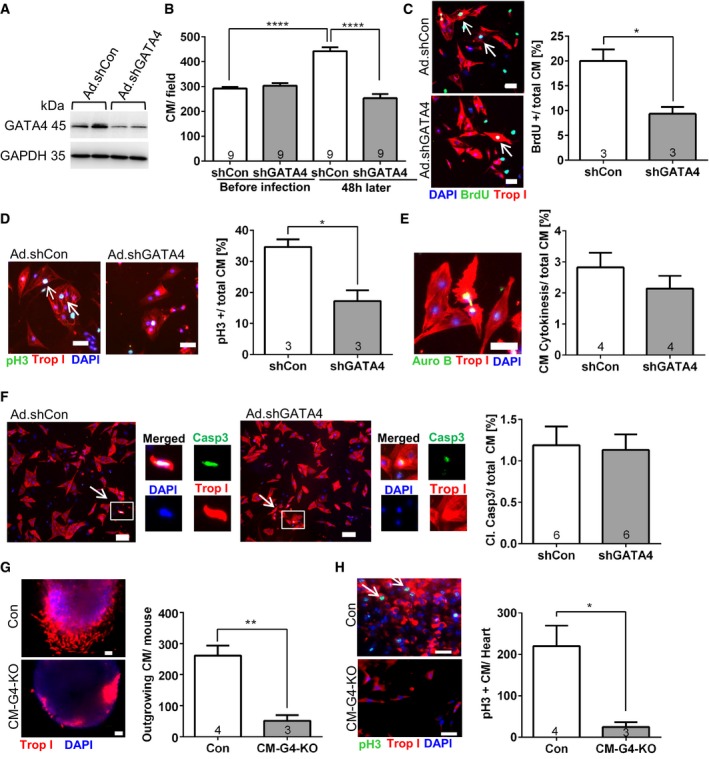
Representative immunoblots for GATA4 and GAPDH (as loading control) of fetal cardiomyocytes treated with adenoviruses (Ad) expressing control shRNA (shCon) or shRNA against Gata4 (shGATA4) for 48 h.
Number of cardiomyocytes (CM) in a defined low‐magnification (50×) microscopic field before the adenoviral infection and 48 h later. ****P < 0.0001.
Representative pictures and quantification of BrdU incorporation in fetal cardiomyocytes 48 h after application of the adenoviruses as indicated and immunostained for BrdU, troponin I (Trop I), and DAPI. Scale bars: 50 μm; *P = 0.0169.
Representative pictures and quantification of cardiomyocytes positive for phospho‐histone H3 (pH3) in fetal cardiomyocytes 48 h after application of the adenoviruses as indicated and immunostained for pH3, troponin I, and DAPI. Scale bars: 50 μm; *P = 0.0145.
Representative picture and quantification of cardiomyocyte cell division in fetal cardiomyocytes 48 h after application of the adenoviruses as indicated and immunostained for aurora B (Auro B), troponin I, and DAPI. Scale bar: 50 μm.
Representative pictures, single‐channel enlargements, and quantification of cardiomyocyte apoptosis in fetal cardiomyocytes 48 h after application of the adenoviruses and after immunostaining for cleaved caspase 3, troponin I, and DAPI. Scale bar: 100 μm.
Representative pictures of cardiac explants of the indicated mice embedded in Matrigel shortly after cryoinjury and immunostained for troponin I 7 days later. Quantification of outgrowing cardiomyocytes is shown on the right. The number within bars indicates the number of mice analyzed in that particular group. Scale bars: 50 μm. **P = 0.0037.
Representative pictures of cardiac explants like in (G), stained for pH3 in addition. The quantification is shown on the right. Scale bars: 50 μm. *P = 0.0215.
Data information: (B–H) The number in the bars indicates the number of cell culture plates analyzed. All data are expressed as mean ± SEM. Unpaired Student's
‐test (C–H) and one‐way ANOVA with Sidak's multiple comparisons test (B) were used to compare groups.

