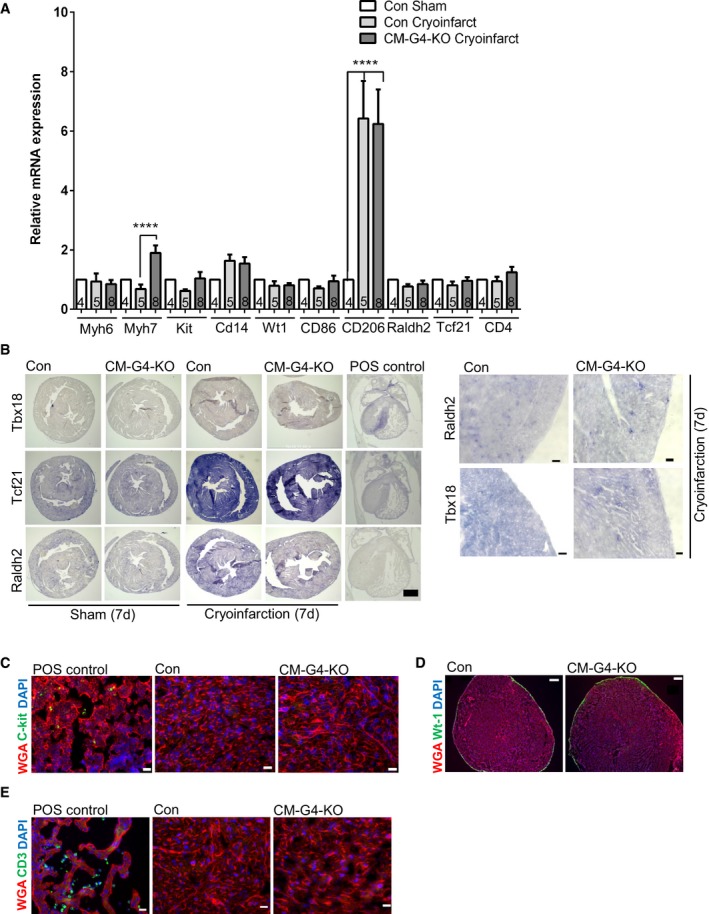
Figure EV3. Cell type‐specific gene expression in CM‐G4‐KO mice.

- Expression of the indicated genes assessed by qPCR in the mice as shown; ****P < 0.0001. Data are expressed as mean ± SEM. One‐way ANOVA with Sidak's multiple comparisons test was used to compare groups. Data are expressed as mean ± SEM. One‐way ANOVA with Sidak?s multiple comparisons test was used to compare groups. The number within bars indicates the number of mice analyzed in that particular group.
- In situ hybridization to detect Raldh2, Tcf21, or Tbx18 in the myocardium of the indicated mice 7 days after sham surgery or cryoinfarction to assess epicardial activation. Staining in the embryonic mouse heart served as positive (POS) control. Scale bar: 200 μm. A higher magnification of the epicardial region is shown on the right. Scale bar: 20 μm.
- c‐kit immunofluorescence staining of a positive control (embryo liver lobes at embryonic day (E) 12) and 7‐day‐old heart tissues of the indicated mice after injury. Scale bars: 20 μm.
- Wt‐1 immunofluorescence staining of 7‐day‐old Con and CM‐G4‐KO mice after cryoinjury. Scale bars: 200 μm.
- Myocardial immunofluorescence staining for CD3 as a marker of T cells of the indicated mice 7 days after cryoinjury. An embryonic heart section (from E12) was used as positive control. Scale bars: 20 μm.
