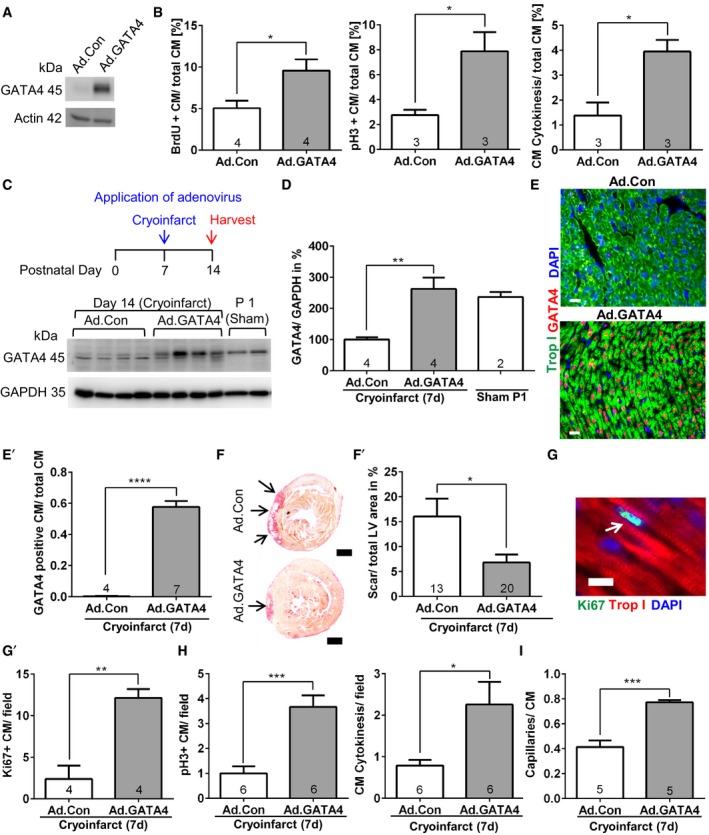
Representative immunoblot for GATA4 and GAPDH from neonatal cardiomyocytes treated with control (Ad.Con) or GATA4‐expressing adenovirus (Ad.GATA4).
Quantification of BrdU incorporation, pH3 labeling, and cytokinesis in neonatal cardiomyocytes treated as shown. *P = 0.0272 for BrdU incorporation, *P = 0.0329 for pH3 labeling, *P = 0.0217 for cytokinesis.
Immunoblot for GATA4 and GAPDH of mouse hearts treated as shown in the experimental timescale above.
A quantification of the immunoblot from (C) is shown; **P = 0.0062.
Representative pictures of myocardial sections immunostained for the indicated proteins from mice 7 days after cryoinjury and treatment with Ad.Con or Ad.GATA4. The quantification of cardiomyocytes (CM) staining positive for GATA4 vs. total cardiomyocytes is shown as bar graph (E′). Scale bars: 20 μm. ****P < 0.0001.
Representative Sirius red‐stained heart sections of mice 7 days after cryoinjury (performed at P7) and treated with adenoviruses as indicated. The scar is displayed in red (arrows). Scale bar: 500 μm. The quantification of left ventricular (LV) scar area of mice 7 days after cryoinjury is shown as bar graph (F′). *P = 0.0135.
Representative picture of a myocardial section immunostained for the indicated proteins 7 days after cryoinjury. Scale bar: 10 μm. Quantification of Ki67‐positive cardiomyocytes in these mice (G′). **P = 0.0023.
Quantification of pH3‐positive cardiomyocytes and cardiomyocyte (CM) cytokinesis in mice 7 days after cryoinjury; *P = 0.0264, ***P = 0.0006.
Quantification of the capillary/cardiomyocyte ratio in mice 7 days after cryoinjury. ***P = 0.0002.
Data information: (B, D–I) The number within bars indicates the number of mice analyzed in that particular group. All data are expressed as mean ± SEM. Unpaired Student's
‐test (B, E–I) and one‐way ANOVA with Sidak's multiple comparisons test (D) were used to compare groups.

