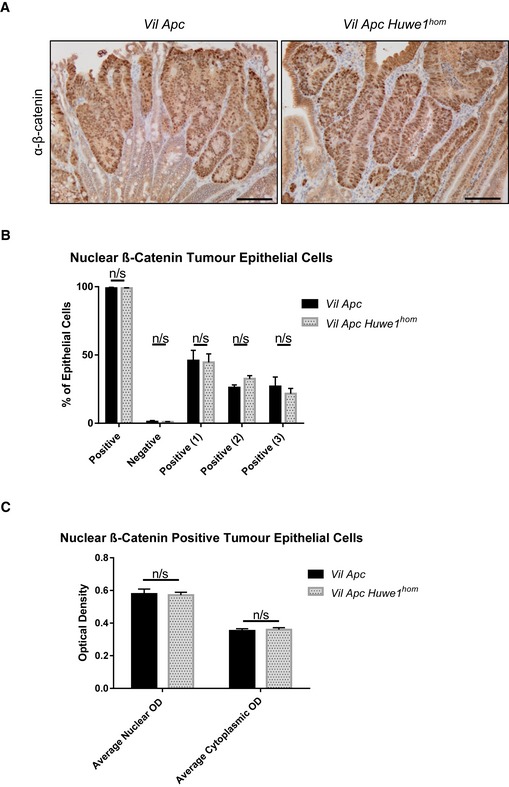
Figure EV2. Huwe1‐deficient tumours display β‐catenin nuclear localisation.

- β‐Catenin IHC of Vil Apc and Vil Apc Huwe1 hom adenomas demonstrating nuclear localisation. Scale bars = 100 μm.
- Quantification of percentage of nuclear β‐catenin‐positive cells in Vil Apc and Vil Apc Huwe1 hom adenomas. Values 1, 2 and 3 represent low, medium and high OD, respectively (Mann–Whitney, n = 3 versus 3). Data are mean and SEM.
- Quantification of β‐catenin staining intensity in Vil Apc and Vil Apc Huwe1 hom adenomas (Mann–Whitney, n = 3 versus 3). Data are mean and SEM.
