
Figure EV5. Huwe1‐deficient tumours display Apc LOH.
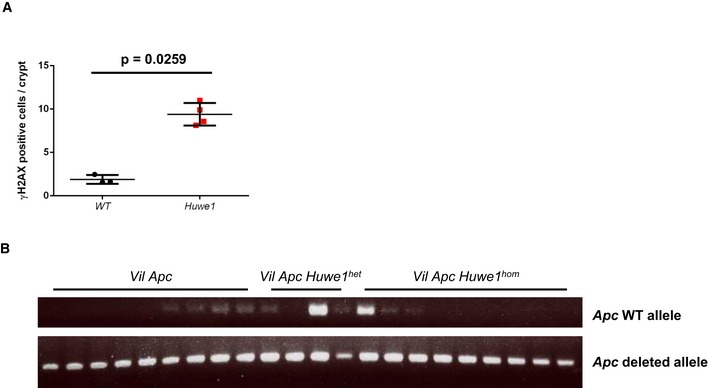
- Quantification of γ‐H2AX IHC demonstrating increased number of nuclei staining positive following Huwe1 deletion (Mann–Whitney, n = 3 versus 4). Data plotted are mean and SD.
- Apc LOH PCR analysis of tumours isolated from Vil Apc, Vil Apc Huwe1 het and Vil Apc Huwe1 hom mice. The majority of tumours display Apc LOH.