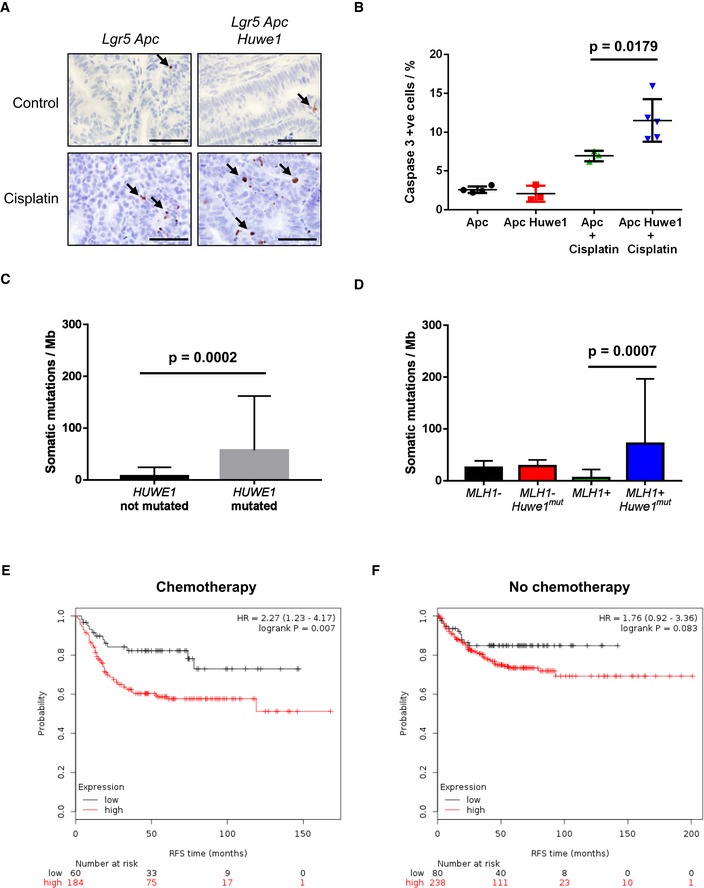
Caspase‐3 IHC of tumours from Lgr5 Apc and Lgr5 Apc Huwe1 mice either untreated or treated with 7.5 mg/kg cisplatin 6 h post‐treatment. Arrows identify caspase‐3‐positive cells. Scale bars = 50 μm.
Quantification of cisplatin treatment showing a significant increase in apoptosis in Huwe1‐deficient tumour cells (Mann–Whitney, n = 3 versus 5). Data plotted are mean and SD.
Comparison of somatic mutation rate (mutations/Mb) between human tumours carrying HUWE1 mutations or not. Note the significant increase in mutational burden in HUWE1‐mutated tumours (Mann–Whitney, P = 0.0002, n ≥ 15). Data plotted are mean and SD.
Comparison of somatic mutation rate (mutations/Mb) between human tumours carrying HUWE1 mutations or not grouped according to MLH1 status. Note that the increased mutation rate is found primarily in tumours where MLH1 is not silenced indicating increased mutation rate (and HUWE1 mutation itself) is not due to silencing of MLH1 (Mann–Whitney, P = 0.0007, n ≥ 11). Data plotted are mean and SD.
Survival analysis of colorectal cancer patients treated with adjuvant chemotherapy divided by HUWE1 expression levels. Note the lowest HUWE1‐expressing quartile of patients respond significantly better to chemotherapy.
Survival analysis of colorectal cancer patients not treated with adjuvant chemotherapy divided by HUWE1 expression levels. Note the lowest HUWE1‐expressing quartile of patients do not survive significantly longer than those expressing higher levels of HUWE1 if not treated with chemotherapy.