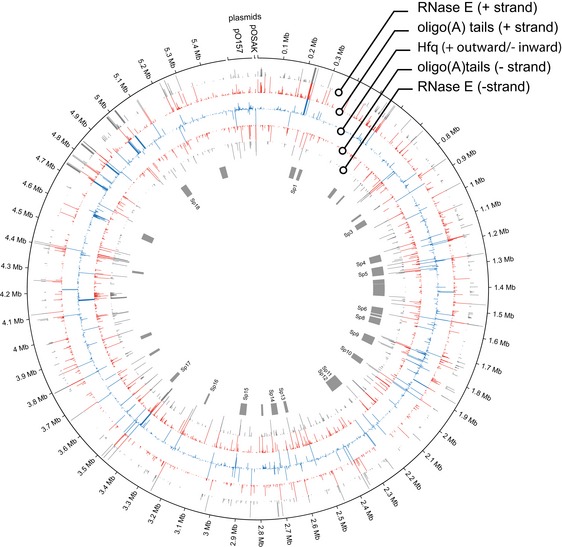
Figure EV2. Circos plot of RNase E binding sites (grey), non‐genomically encoded oligoadenylation sites (red), and Hfq binding sites (blue).

Positive strand binding sites are shown in the outer rings and negative strand binding in the inner rings. Pathogenicity islands (S‐loops [Sp]) are shown in grey (centre).
