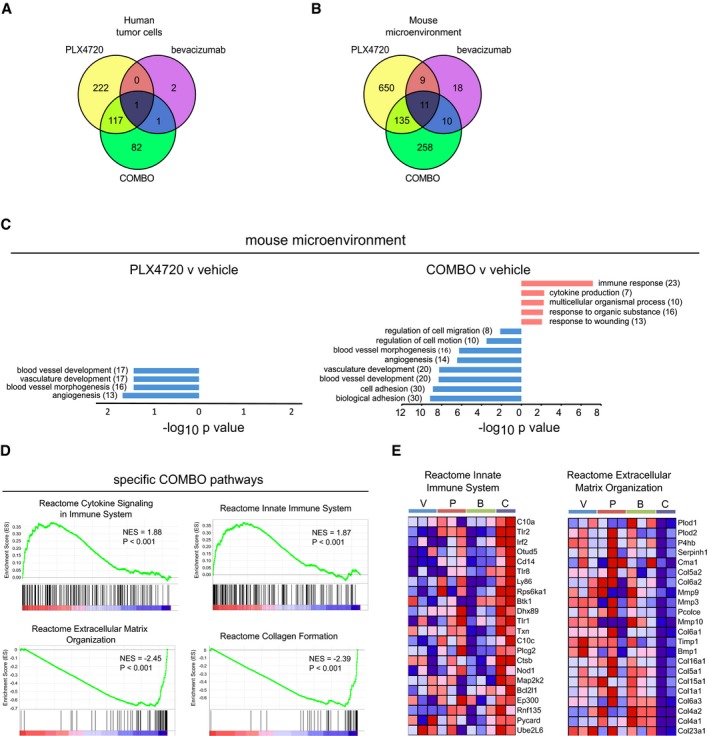
Venn diagram showing the overlapping subsets of modulated human genes (fold change |log2| ≥ 1, P‐value < 0.01) in the PLX4720, bevacizumab, and COMBO treatments versus vehicle.
Venn diagram showing the overlapping subsets of modulated murine genes (fold change |log2| ≥ 1, P‐value < 0.01) in the PLX4720, bevacizumab, and COMBO treatments versus vehicle.
Summary of the functional categories of mouse genes significantly enriched in response to PLX4720 and COMBO. GO analyses were performed individually on down‐ or up‐regulated genes using DAVID tool (biological process). GO terms are ranked by
P‐value corrected by BH method, and the number of genes is indicated. For a complete list of significantly enriched GO groups see
Appendix Tables S3 and
S4.
GSEA enrichment plots for “Reactome Cytokine Signaling in Immune System” and “Reactome Innate Immune System” (upper panels) and “Reactome Extracellular Matrix Organization” and “Reactome Collagen Formation” (lower panels) highlight significant enrichment of the pathways relative to the immune response and a decreased expression of the pathways relative to extracellular matrix remodeling in COMBO‐treated tumors as compared to the other treatments (vehicle, PLX4720, bevacizumab).
Heatmap representation of gene expression changes within the “Reactome Innate Immune System” (left panel) and “Reactome Extracellular Matrix Organization” (right panel) gene set. Genes in heatmaps are shown in rows, and samples are shown in columns. Expression level is represented as a gradient from high (red) to low (blue). V, P, B and C, respectively, indicate vehicle, PLX4720, bevacizumab, and COMBO.

