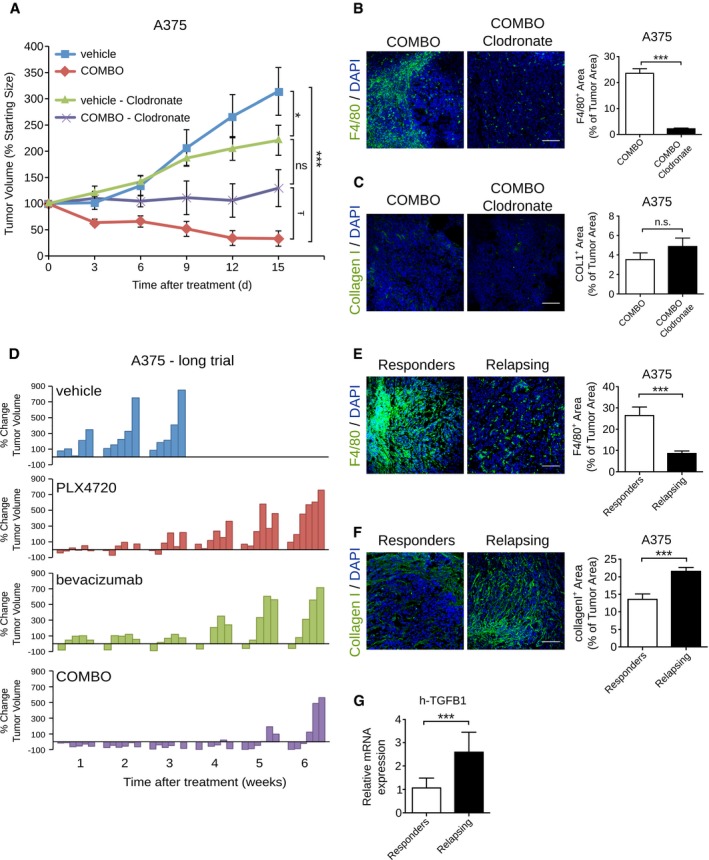
Effect of clodronate liposomes on tumor growth inhibition induced by COMBO treatment in mice bearing A375 tumors. Tumor growth is expressed as % change of the initial tumor. Macrophage depletion by clodronate liposome enhanced the tumor growth of tumors treated with the combination of PLX4720 and bevacizumab (n = 5 mice/group). *P = 0.049 vehicle + clodronate versus vehicle, ***P = 5.72E‐06 COMBO versus vehicle, Ŧ
P = 0.033 COMBO + clodronate versus COMBO.
Representative images of macrophage infiltration determined by F4/80 immunofluorescence staining in A375 xenografts treated as indicated. Bar graphs indicate the F4/80+ area/tumor (n = 3 tumors), ***P = 1.53E‐25 versus vehicle.
Representative images of collagen deposition determined by collagen I immunofluorescence staining in A375 xenografts treated as indicated. Bar graphs indicate the collagen I+ area/tumor (n = 3 tumors).
Waterfall plots showing the percent change in volume (relative to the initial tumor volume) for the individual A375 xenografts in each treatment group (vehicle, PLX4720, bevacizumab, and COMBO) from week 1 to week 6.
Representative images of macrophage infiltration determined by F4/80 immunofluorescence staining in a responder and a relapsing A375 xenografts. Bar graphs indicate the F4/80+ area/tumor (n = 3 mice). ***P = 1.25E‐06 versus vehicle.
Representative images of collagen deposition determined by collagen I immunofluorescence staining in a responder and a relapsing A375 xenografts. Bar graphs indicate the collagen I+ area/tumor (n = 3 mice). ***P = 4.03E‐05 versus vehicle.
Real‐time quantitative PCR of h‐TGFB1 in A375 xenograft treated with PLX4720, bevacizumab, or COMBO. Data are presented as expression fold change (log2) of relapsing tumors compared to responder tumors after normalization for the housekeeping gene TBP (n = 3 tumors). ***P = 0.0006 versus vehicle.
Data information: The scale bars represent 100 μm. The results are given as the mean ± SEM. Significance was assessed by one‐way ANOVA test followed by
test (B, C, E–G).

