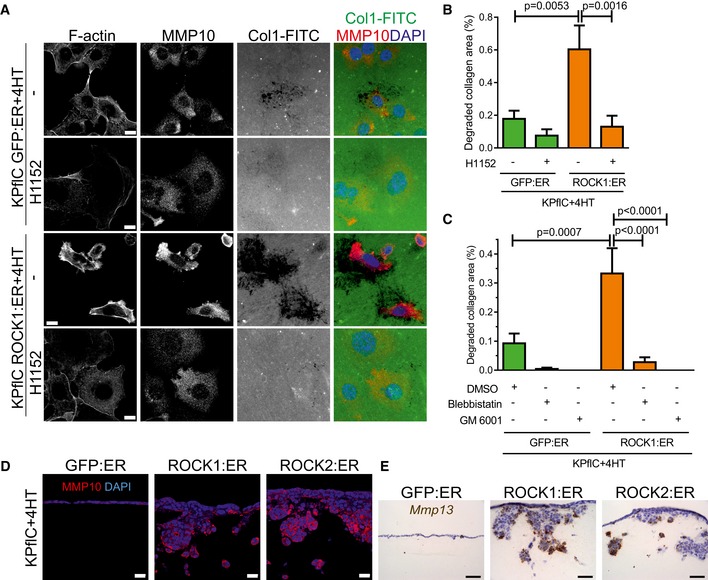
Figure 6. ROCK activation promotes collagen degradation.

- Representative fluorescence images of cells treated with 1 μM 4HT in the absence or presence of 10 μM H1152 for 18 h on Collagen1‐FITC (Col1‐FITC). Co‐staining for F‐actin, MMP10 (red), and DAPI (blue). Scale bar = 10 μm.
- Quantification of collagen degradation by cells treated with 1 μM 4HT or 4HT + 10 μM H1152 for 16 h. Means ± SEM (n = 15), one‐way ANOVA with multiplicity adjusted exact P‐value by post hoc Tukey multiple comparison test.
- Quantification of collagen degradation by cells treated with 1 μM 4HT, 4HT + DMSO vehicle, 4HT + 50 μM Blebbistatin or 4HT + 10 μM GM6001 for 16 h. Means ± SEM (n = 15), one‐way ANOVA with multiplicity adjusted exact P‐value by post hoc Tukey multiple comparison test.
- Immunofluorescence of collagen matrix sections co‐stained for MMP10 and DAPI. Scale bar = 20 μm.
- Mmp13 in situ hybridization‐stained sections of collagen matrices. Scale bar = 50 μm.
