-
A
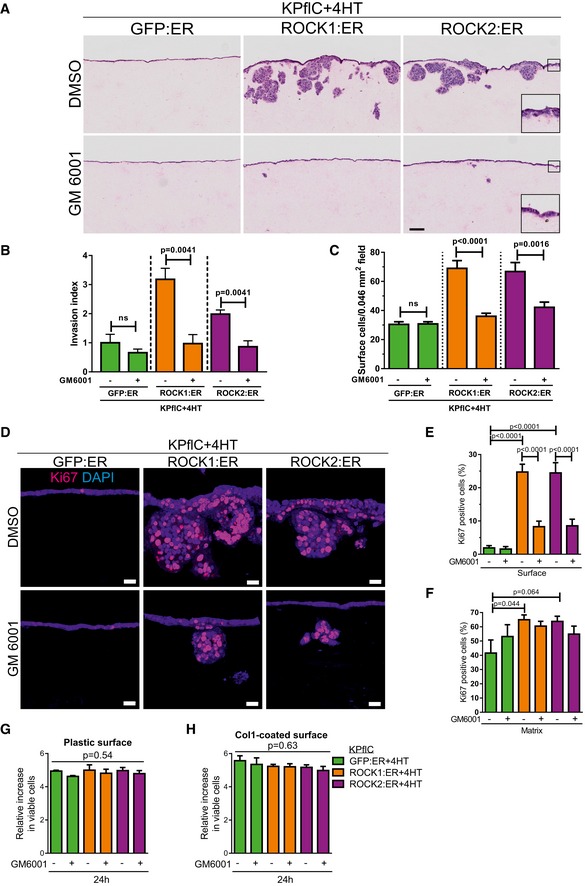
H&E‐stained sections of cell invasion into collagen matrix after 8 days, in the absence (top) or presence of 10 μM GM6001 (bottom). Scale bar = 100 μm.
-
B
Invasion index of KPflC cells. Means ± SEM (n = 4), P‐value by unpaired t‐test.
-
C
Quantification of cell number at the collagen matrix surface per 0.046 mm2 field. Means ± SEM (n = 20), P‐value by unpaired t‐test.
-
D
Cell proliferation determined by Ki67 immunofluorescence. Scale bar = 20 μm.
-
E
Ki67‐positive cell percentages at the collagen matrix surface. Means ± SEM (n = 20; n = 19 for GFP:ER/vehicle, n = 18 for GFP:ER/GM6001), one‐way ANOVA with multiplicity adjusted exact P‐value by post hoc Tukey multiple comparison test.
-
F
Ki67‐positive cell percentages in collagen matrix. Means ± SEM (n = 20; n = 8 for GFP:ER/vehicle, n = 10 for GFP:ER/GM6001, n = 17 for ROCK1:ER/GM6001, n = 15 for ROCK2:ER/GM6001), one‐way ANOVA with multiplicity adjusted exact P‐value by post hoc Tukey multiple comparison test.
-
G, H
The increase in viable cell numbers of cells plated on uncoated plastic surfaces (G) or collagen1 (Col1)‐coated surfaces (H) and treated with 1 μM 4HT for 24 h was not affected by 10 μM GM6001. Means ± SEM (n = 3), one‐way ANOVA with multiplicity adjusted exact P‐value by post hoc Tukey multiple comparison test.

