
Figure EV2. Top1‐dependent short deletions at unrepaired ribonucleotides occur independent of DSB repair.
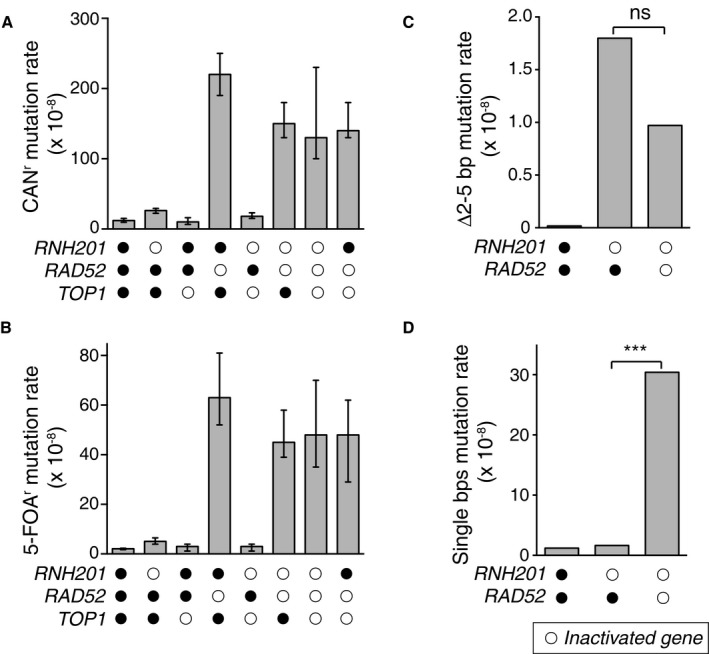
Open circles indicate inactivated genes for each strain.
-
A, B(A) Overall CAN1 mutation rates for strains with deletions of indicated genes. Spontaneous mutation rates were determined using fluctuation analysis as described previously (Shcherbakova & Kunkel, 1999). (B) Same as in panel (A), but for 5‐FOA‐resistance (5‐FOAr) conferred by mutation of the URA3 reporter gene in orientation 2 adjacent to the ARS306 replication origin (Nick McElhinny et al, 2008). Displayed are mean values ± the 95% confidence interval. The experiment was performed twice and mutation rate measurements were calculated for 24 independent isolates per genotype per experiment. Displayed are median values ± the 95% confidence interval.
-
CDisplayed are 2–5 bp deletion mutation rates comparing WT, rnh201Δ, and rnh201Δ rad52Δ strains calculated from data listed in Appendix Table S1 for the URA3‐OR2 reporter. This rate was calculated using mutation spectra from Nick McElhinny et al (2010a) for the WT strain and from Clark et al (2011) for the rnh201Δ strain. 2–5 bp deletion rates were calculated by multiplying the proportion of this mutation type by the overall mutation rate for each strain. ns: P = 0.089 (Monte Carlo simulation) (Lujan et al, 2013). This demonstrates that the 2–5 bp deletion rate is not statistically significantly different when comparing the rnh201Δ strain to the rnh201Δ rad5Δ strain.
-
DDisplayed are base pair substitution rates comparing WT, rnh201Δ, and rnh201Δ rad52Δ strains calculated from data listed in Appendix Table S1 for the URA3‐OR2 reporter. ***P ≤ 0.001 (the rate is calculated as described in panel C).