
Figure 3. Deletion of RAD51 in a yeast strain containing a large number of unrepaired leading strand ribonucleotides (pol2‐M644G rnh201Δ) causes genome instability phenotypes that are Top1 dependent.
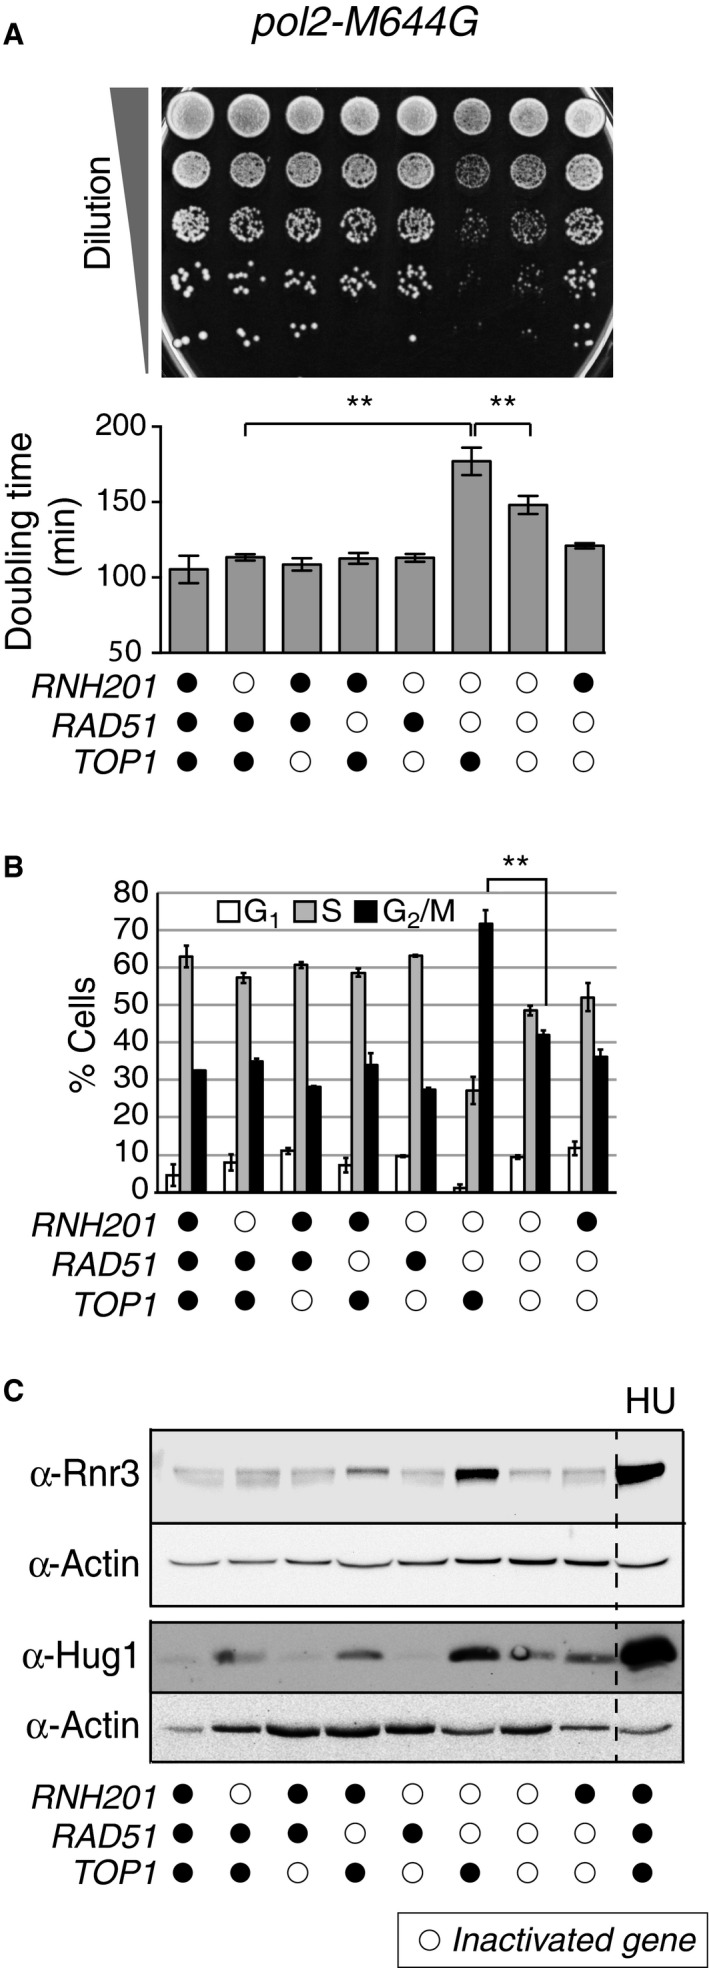
All strains harbor the pol2‐M644G mutation, and open circles indicate additional inactivated genes for each strain.
- Slow growth caused by loss of RAD51 in a pol2‐M644G rnh201Δ strain is Top1 dependent. Upper panel: Tenfold serial dilutions of exponentially growing yeast strains with combinations of indicated gene deletions were spotted onto a YPDA agar plate and grown for 2 days at 30°C. Lower panel: Doubling times (D t) were calculated for respective strains in the logarithmic phase of growth in rich medium at 30°C. **P ≤ 0.01 (Student's t‐test in GraphPad Prism). The experiment was performed in triplicate. Data are displayed as the mean D t ± standard deviation (SD).
- Flow cytometry analysis of cell cycle progression reveals that deletion of RAD51 in a pol2‐M644G rnh201Δ strain causes accumulation of cells in G2/M phase in a Top1‐dependent manner. Representative histograms are presented in Appendix Fig S2B. Bar graphs display the percentage of cells in G1, S, or G2/M phase. The experiment was performed twice, and mean values are plotted ± SD. **P ≤ 0.01 (Student's t‐test in GraphPad Prism).
- Activation of the genome integrity checkpoint was measured by immunoblotting for Rnr3 and Hug1 in whole cell extracts from the indicated strains. Increase in Rnr3 and Hug1 expression levels serves as a sensitive indicator of genome integrity checkpoint activation (Basrai et al, 1999; Kumar et al, 2010; Davidson et al, 2012). Hydroxyurea (HU)‐treated (200 mM for 3 h) cells served as a positive control.