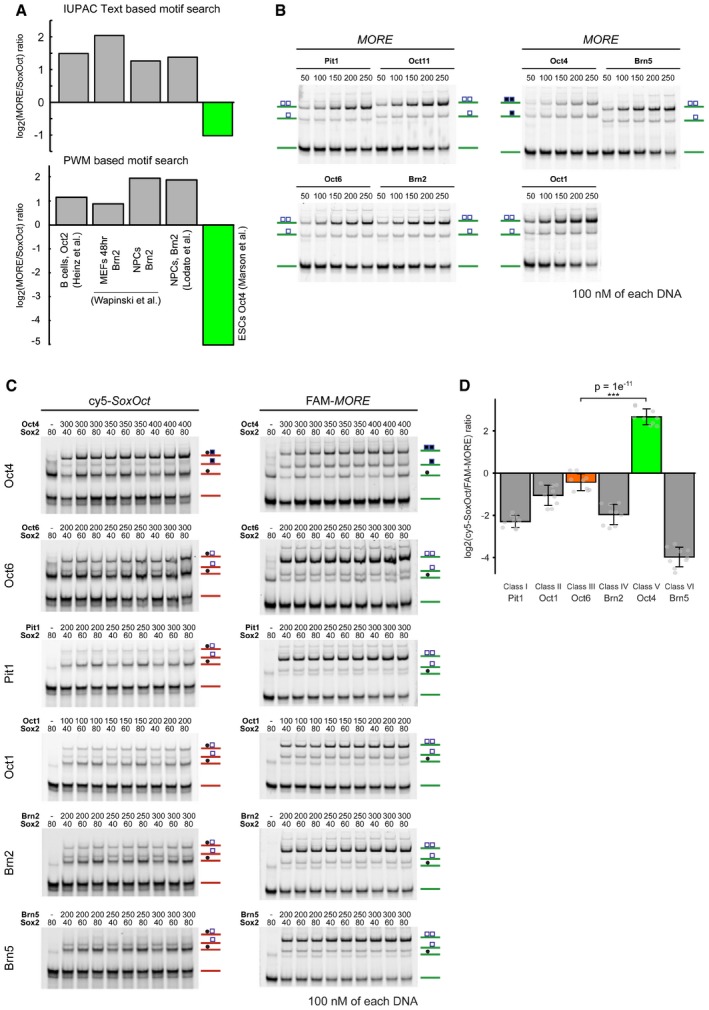
Figure EV1. The POU factor Oct4 exhibits a unique DNA‐binding preference.

- To count the relative abundance of the OctOct (MORE) versus SoxOct motif, the presence of position weight matrices obtained was analyzed using HOMER (lower panel) 39. References for ChIP‐Seq data sets are in order (left to right): Oct2 in B cells 39, Brn2 after 48 h of its overexpression in MEFs 54, Brn2 in NPCs 54, Brn2 in NPCs 55, and Oct4 in ESCs 72. The upper panel was generated using word searches with IUPAC strings instead of pwms on the same set of ChIPseq peaks as in the lower panel.
- Representative EMSAs used for omega calculations showing the formation of Oct–Oct homodimers on the MORE DNA element for a panel of seven POU proteins. Complexes were separated on native gels and subsequently imaged. Note, in Fig 1E and F, only data for Oct1 but not the closely related Oct11 are shown.
- Representative EMSAs performed as single‐tube reactions containing the Sox2 HMG and POU domains of Oct transcription factors, in combination with Cy5‐labeled SoxOct and FAM‐labeled MORE DNA elements. Complexes were separated on native gels and sequentially imaged using FAM and Cy5 channels.
- Bar plots representing differences in DNA‐binding preference as determined by single‐tube EMSA reactions for a panel of six POU proteins (classes I‐VI) represented as log2 ratios of hetero‐ and homodimer band intensities on Cy5‐OctSox and FAM‐MORE DNA elements, respectively. Individual data points are shown as gray jitter plot. The mean is shown with standard deviation as error bars (n = 9), and Tukey's multiple comparison of means was performed to assess statistical significance (***P < 0.001).
Source data are available online for this figure.
