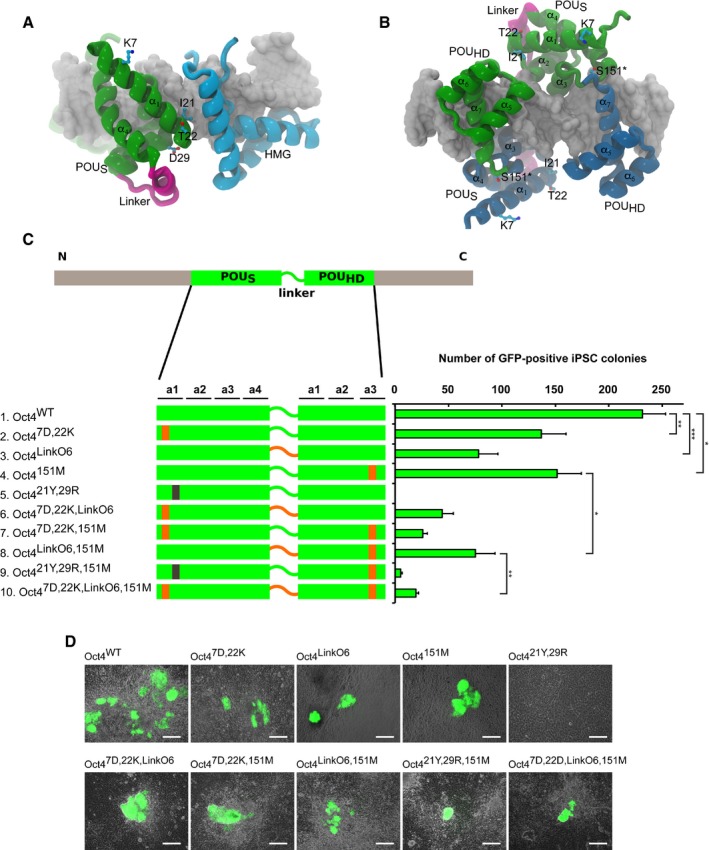
Figure 3. The residue guiding DNA‐binding preference is a key Oct4 determinant in pluripotent cell generation.

-
A, BMolecular models show the position of mutated residues in the structures of two dimers on DNA: Sox2–Oct4 heterodimer (A) and Oct4–Oct4 homodimer (B). Ser in position 151 (asterisk) was mutated to Met in order to shift the preference of Oct4 for homodimerization. The individual helixes of the POU domains are numbered.
-
COn the left side, a schematic overview of Oct4 and its mutants used for iPSC generation. POUS and POUHD are shown as green bars connected by the linker. Sites mutated to the respective Oct6 residues and Oct6 linker are denoted in orange, and the mutation in the Sox–Oct interface is in black. The efficiency of these constructs for iPSC generation from MEFs is depicted as the absolute number of GFP‐positive colonies on the right. Error bars represent standard deviations of biological replicates (n = 3), and differences between selected samples were compared using ANOVA (P‐values: Oct4WTxOct47D,22K P = 6.9e‐3; Oct4WTxOct4LinkO6 P = 7.3e‐4; Oct4WTxOct4151M P = 1.2e‐2; Oct4151MxOct4LinkO6,151M P = 1.1e‐2; Oct4LinkO6,151M xOct47D,22K,LinkO6,151M P = 7.1e‐3) (***P < 0.001, **P < 0.01, *P < 0.05).
-
DGFP‐positive colonies of mouse iPSCs generated by Oct4 mutants in combination with Sox2, Klf4, and c‐Myc. Colonies were imaged 16 days after second viral infection, using a fluorescence microscope. Scale bars: 250 μm; 10× objective.
Source data are available online for this figure.
