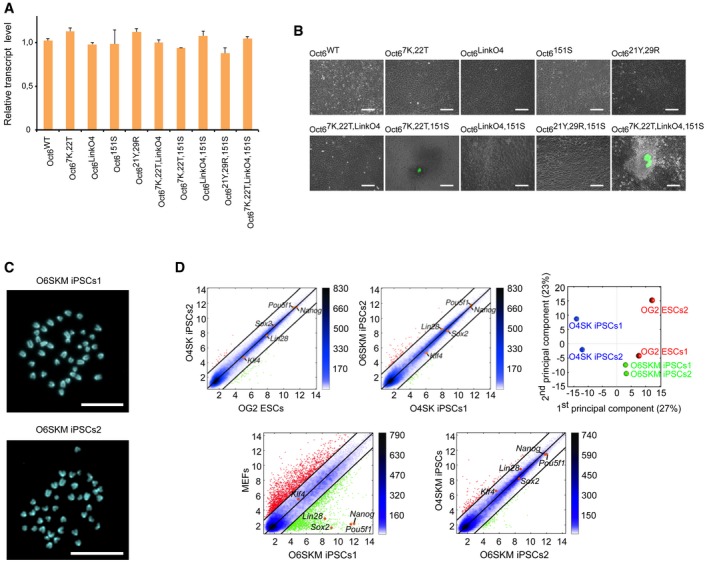
Figure EV4. O6SKM‐induced pluripotent cells have normal karyotype and global gene expression profile, similar to embryonic stem cells.

- The relative transcript levels of Oct6 and its mutants were analyzed by qRT–PCR. The mean values for biological replicates using viral supernatants from same reprogramming experiments are shown with the standard deviation as error bars (n = 2).
- Oct4‐GFP‐positive colonies of mouse iPSCs generated by Oct6 mutants in combination with Sox2, Klf4, and c‐Myc. Colonies were imaged 16 days after viral infection, using a fluorescence microscope. Scale bars: 250 μm.
- Karyotyping of two stable mouse O6SKM iPSC lines revealed that cells from both lines carry the correct number of chromosomes—40. Scale bars: 20 μm.
- Pairwise scatter plots comparing global gene expression profiles of O6SKM iPSC lines with OG2 ESCs, O4SK iPSCs, and previously published O4SKM iPSCs and MEFs. Black lines represent a twofold change in gene expression levels between the paired cell lines. On the right side of the plots, color bar indicates scattering density. Red and green dots represent up‐ and downregulated genes, respectively. Positions of selected pluripotency‐related genes are highlighted as orange points. Principal component analysis highlighting the close relationship between global gene expression profiles of O6SKM iPSCs (green circles), OG2 ESCs (red circles), and O4SK iPSCs (blue circles) is shown in the upper right corner.
