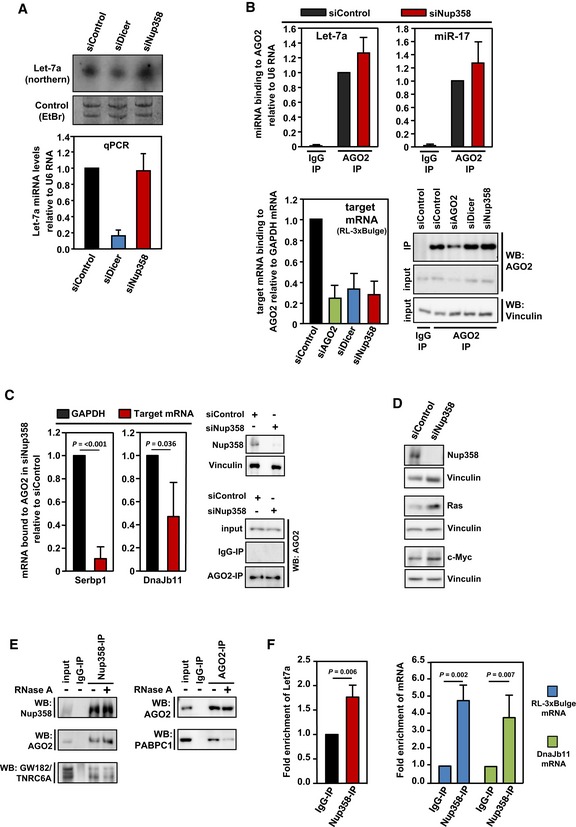
HeLa cells were transfected with control, Dicer, or Nup358‐specific siRNAs, as indicated. Upper panel: Total RNA was isolated and analyzed by Northern blotting for let‐7a using radiolabeled probe. Ethidium bromide (EtBr)‐stained gel indicates equal loading of RNA samples. Bottom panel: Total RNA was isolated from control, Dicer‐, or Nup358 siRNA‐treated cells and was reverse‐transcribed using TaqMan microRNA reverse transcription kit. The levels of let‐7a were quantified by qPCR following the manufacturer's instructions. Graph represents the relative levels of miRNAs as compared to U6 RNA control. The values were further normalized to let‐7a levels in control siRNA knockdown condition. Data are presented as mean ± SD (n = 3).
HeLa cells were transfected with indicated siRNAs, followed by RL‐3xBulge construct. Immunoprecipitation (IP) was performed with control mouse IgG (IgG‐IP) or anti‐AGO2 antibody (AGO2‐IP) using lysates prepared from these cells. Total RNA was isolated from control and AGO2 immunoprecipitates and the levels of AGO2‐associated let‐7a (top left panel) and miR‐17 (top right panel) were quantified by qPCR. Graph represents the extent of miRNAs associated with AGO2 as compared to U6 RNA (as a negative control) with AGO2. Bottom left panel: RNA isolated from IgG control or AGO2 immunoprecipitate samples was reverse‐transcribed using oligo(dT) primer. RL‐3xBulge mRNA association with AGO2 was quantified by qPCR and normalized to the level of GAPDH mRNA associated with AGO2. Bottom right panel: AGO2 immunoprecipitates were analyzed by Western blotting using AGO2‐specific antibody. Vinculin was used as loading control. Data are presented as mean ± SD (n = 3).
HeLa cells were transfected with control (siControl) or Nup358‐specific siRNA (siNup358) for 96 h. Cells were lysed and subjected to immunoprecipitation with control IgG (IgG‐IP) or anti‐AGO2 (AGO2‐IP). Total RNA was extracted from initial lysate and IP samples and analyzed by qPCR for validated miRNA targets, Serbp1 and Dnajb11. GAPDH was considered as negative control. Data expressed as the relative amount of target mRNA associated with AGO2 as compared to GAPDH mRNA. Western blots indicate the extent of Nup358 depletion and AGO2 immunoprecipitation in siControl and siNup358 samples. Vinculin was used as loading control. Data are presented as mean ± SD (n = 3), P‐values were calculated using Student's t‐test.
HeLa cells were treated with indicated siRNAs for 96 h. Cells were lysed and analyzed for extent of Nup358 depletion and for the levels of validated miRNA targets, Ras and c‐Myc, by Western analysis. Vinculin was used as loading control.
HeLa cells were lysed and immunoprecipitation was performed with control (IgG‐IP) or Nup358 (Nup358‐IP, left panel) or AGO2 (AGO2‐IP, right panel) using specific antibodies. The immunoprecipitates were washed with a buffer containing (+) or not containing (−) RNase A and probed for the presence of indicated proteins by Western blotting.
HeLa cells were transfected with RL‐3xBulge construct and immunoprecipitation was performed using control (IgG‐IP) or Nup358 (Nup38‐IP) antibodies. Total RNA was isolated from the immunoprecipitates and analyzed for let‐7a miRNA (left panel), RL‐3xBulge mRNA, and the endogenous miRNA target Dnajb11 using qPCR (right panel). Fold enrichment in Nup358‐IP as compared to IgG control was calculated, and the data are presented as mean ± SD (n = 3), P‐values were obtained using Student's t‐test.

